So how has this winter been treating you? For most areas of the nation, a familiar gauge used to assess a winter's severity is the amount of fuel that we need to keep our homes warm over the winter. In other words, many of us will inquire as to how the winter of 2015-2016 has affected our pocket books when considering space heating. This question becomes more serious if fuel prices increase.
For comparison purposes, we may try to remember how temperatures this winter compare with last winter or to some long-term average. One could inspect the tables of monthly average temperature (in degrees Fahrenheit) that are furnished by the National Weather Service a few days after the end of each month for approximately 250 selected U.S. cities. After near record warmth across the eastern half of the nation in December, above-average temperatures continued along the West Coast and the northern tier of states running from the northern Plains to New England during the month of January 2016. Some locations in Maine had January temperatures that were as much as 8 Fahrenheit degrees above the 30-year normal temperatures for 1981-2010. On the other hand, below-average January temperatures were found across sections of the Great Basin and the southern Rockies in the West, with east central Nevada reporting temperatures as much as 5 Fahrenheit degrees below average. In addition, below average temperatures were found across the Southeast running from northern Florida northward to West Virginia. Alaska reported above average temperatures for January.
However, another way of comparison can be made through monitoring the heating degree-day units that have accumulated for these stations, which serve as more quantitative indicators that gauge the amount of energy required for space heating. The heating degree-day units for each station on each day of the month are determined from the difference the station's daily average temperature (the arithmetic average of the day's maximum and minimum temperature, or the sum of these two temperature readings, which are divided by two) and a base temperature of 65 degrees Fahrenheit. If the day's average temperature were below 65 degrees Fahrenheit, the arithmetic difference in Fahrenheit degrees would represent the number of heating degree day units accumulated for that day, but if the average temperature were at or above 65 degrees, zero heating degree day units are accumulated. A running summation of the number of heating degree day units are made at each station for the entire month, or for the "heating year" extending from 1 July to 30 June of the following calendar year.
During the first several days of each new month, the Climate Prediction Center of the National Weather Service compiles heating degree data for the previous month and posts these data for approximately 360 selected cities around the country. These monthly and seasonal values are compared with the corresponding values for last year to date and for the "normals" representing the 30-year averages for the current 1981-2010 climatological reference interval.
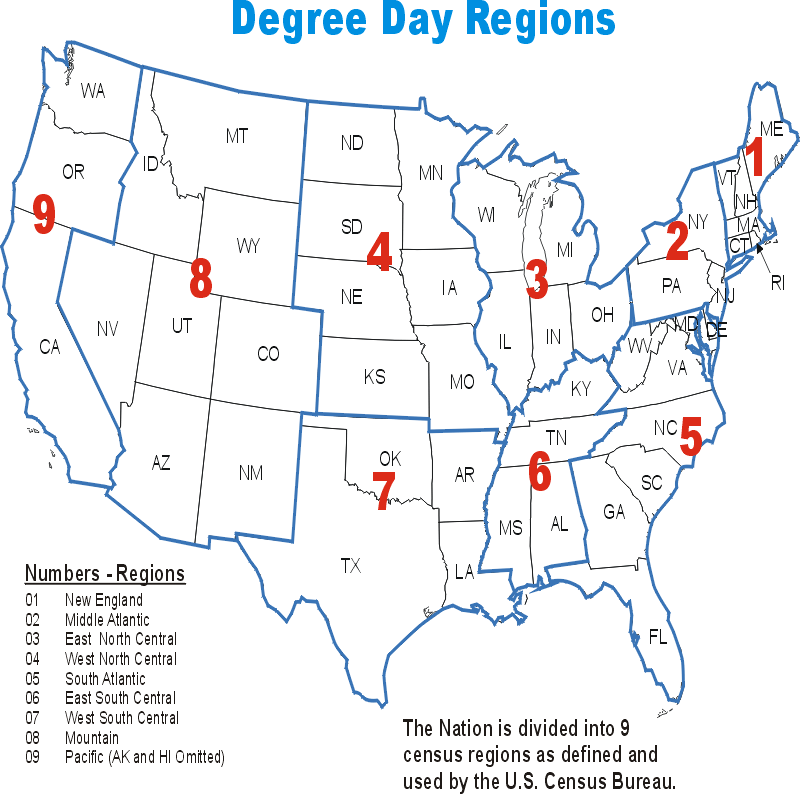
The climatologists at the Climate Analysis Center have also prepared a corresponding list of population weighted heating degree-day units for each state. These latter statistics, which are weighted according to each state's population (2000 Census), are used to show more accurately the temperature-related energy consumption on the state, regional, and national levels based upon population density. Statistics are also generated that involve weighting the states in regions and the regions in the country by the number of residential customers heating with gas, oil, or electricity. [Note: A map is available that identifies the location of the degree day regions used by CPC.]
In the monthly tables prepared by the Climate Prediction Center, the number of heating degree-day units accumulated for the month appears in the column marked "Monthly Total." Adjoining columns display the comparisons between this year and the "normals", as well as with last year. Specifically, the arithmetic differences between the month totals from this year and the "normals" representing the 30-year averages for the current 1981-2010 climatological reference interval appear in the column marked "Month. Dev. from Norm." The difference between the given month this year and the same month last year appear in the column "Month. Dev. from L. YR." Similar columns show the comparisons between the total number of heating degree day units accumulated over the current heating season that started on 1 July and the corresponding values for normals to date and last season to date. Percentage differences are also presented.
Inspection of the most recent tables of the number of heating degree-day units accumulated between last July and the end of January 2016 indicates that most of the contiguous United States needed less energy for space heating over the entire heating season to date as compared with the 1981-2010 normals. Most of the nation extending from the Plains eastward to the Atlantic Coast accumulated between 17 and 23 percent fewer heating degree-day units than normal for the season to date. However, areas across the West (Mountain and Pacific States) had eight to ten percent fewer heating degree-days. When averaged nationwide, the number of heating degree-day units accumulated from 1 July 2015 through 31 January 2016 was 18 percent above "normal." The lower than average number of heating degree-day units reflects the near record warmth across most of the lower 48 states during the second half of 2015. Furthermore, when comparing the current heating season with the previous 2014-15 season, the entire contiguous United States experienced a fewer heating degree-day units (18 percent) this season than the previous one.
Corresponding sets of cooling degree-day units for selected cities and for population-weighted regions were compiled for January 2015 and the cooling season (beginning on 1 January 2016). Cooling degree-day units represent the positive departure of the daily average temperature from the base temperature of 65 degrees Fahrenheit. The arrangement of these monthly tables is similar to that for the corresponding heating degree-day units. How these cooling degree statistics translate into a change in the cost of your utility bill that is not as clear-cut as the cost relationship with the cumulative heating degree-day units. Other factors, such as the atmospheric humidity levels, the amount of sunshine and your life style may also significantly influence your decision to run your air conditioner.
Since the cooling season only started on 1 January and most locales across the nation have not experienced daily average temperatures above 65 degrees, analysis of these cooling degree-day statistics would be somewhat premature. Nevertheless, several areas across the South Atlantic States and the southern Plains had daily average temperatures that were above 65 degrees, but the accumulated cooling degree-day units during January were below normal because of cooler than average weather across the Southeast and Southwest.
Ultimately, the "bottom line" has been that for most residents across the country, the demand for energy to heat homes to date has been below the long-term average. Consequently, the pocketbook has been strained in many areas across the eastern two-thirds of the nation, even if monetary inflation or other non-weather-related price increases are not taken into account.
Return to RealTime Climate Portal
Prepared by Edward J. Hopkins, Ph.D., email hopkins@aos.wisc.edu
© Copyright, 2016, The American Meteorological Society.