This homework contains several parts (separated to reduce potential problems with printing large pdf files). This document helps guide you in finishing the assignment.
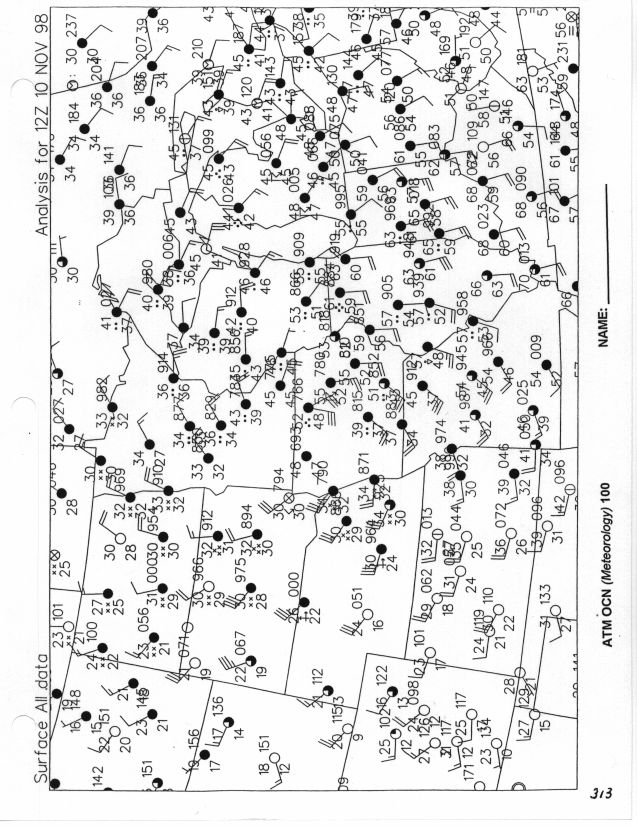
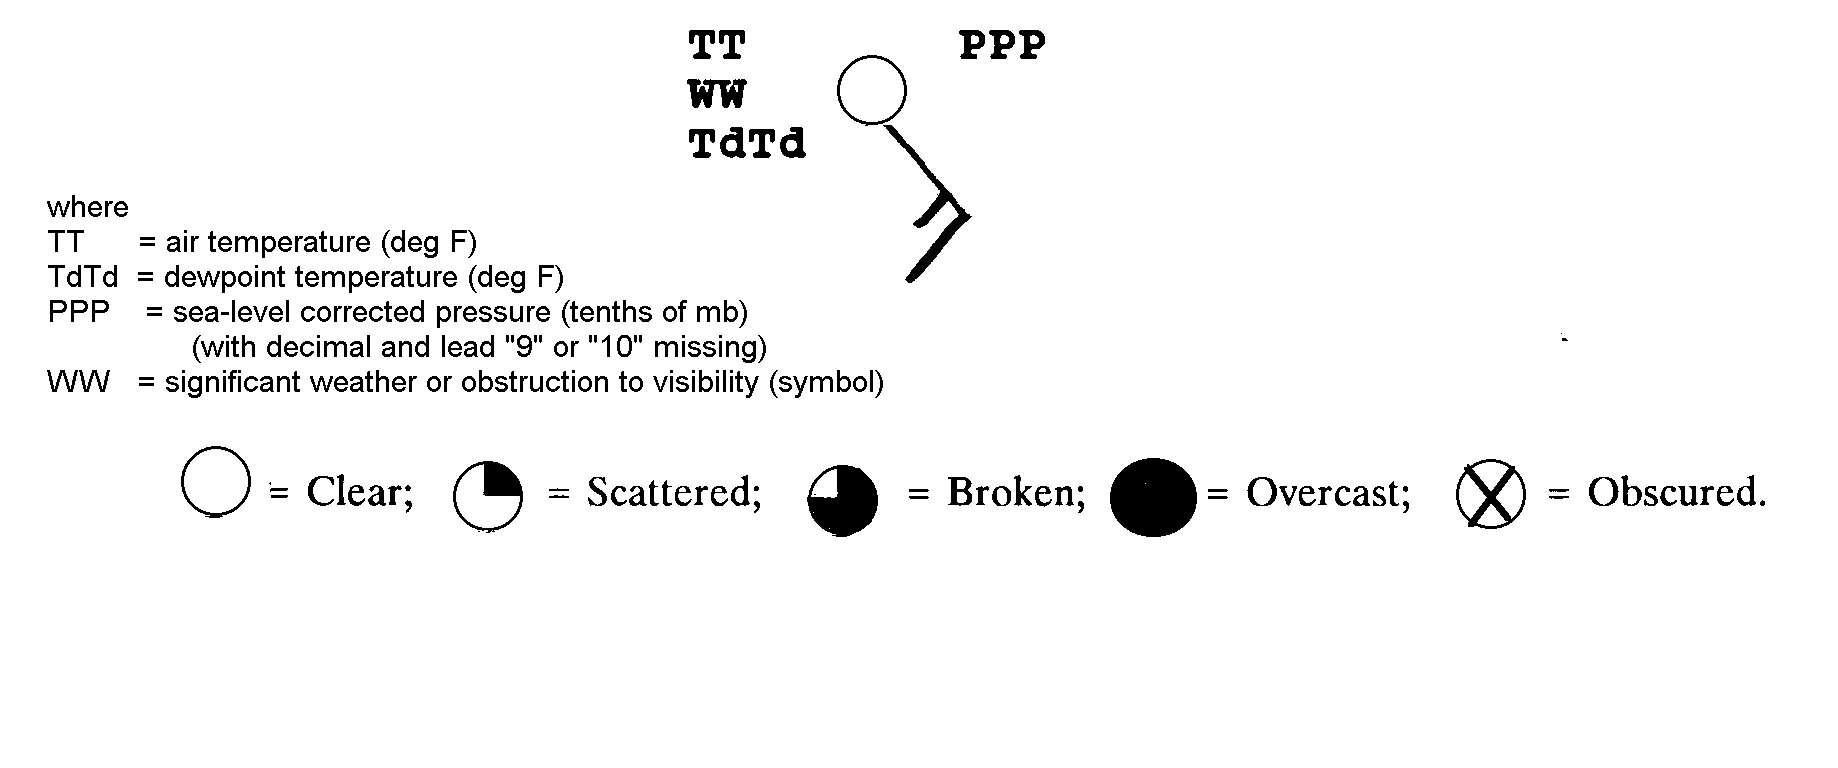
At each station the following abbreviated surface station model has
been utilized:
Wind arrows fly with the wind.
Each full barb equals 10 knot wind speed.
[Sample station reports a 15 knot wind from the southeast (SE)].
Missing values are indicated by an "M".
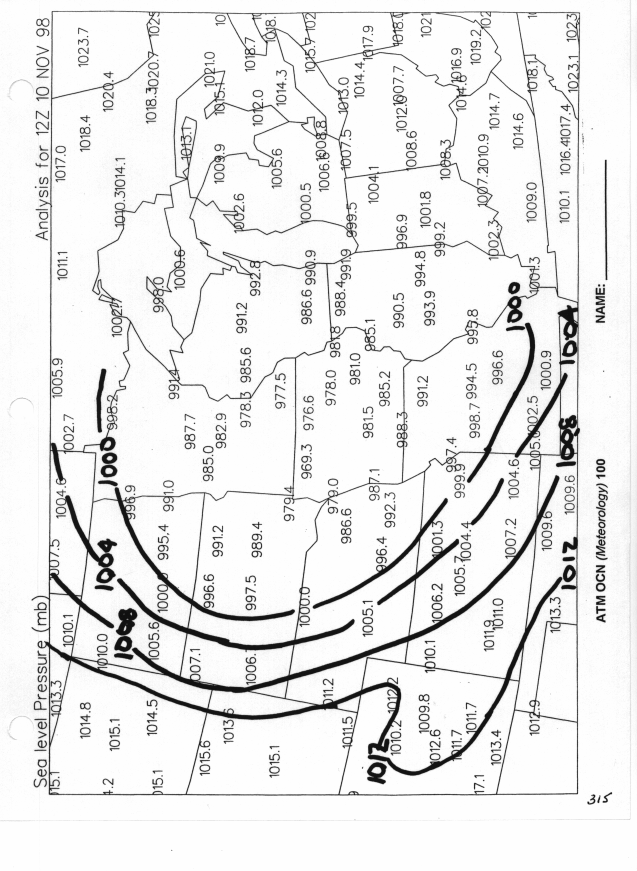
Note the pressure appearing on this station model is in tenths of a
millibar with the decimal and the leading 9 or 10 removed to save
space. (Compare the data plotted on the station model with that for on
the other map that contains the decoded pressure values.)
A nice tutorial for learning how to decode station models can be found
at http://cimss.ssec.wisc.edu/wxwise/station/page5.html
A nice tutorial for learning how to draw isobars is found at
http://cimss.ssec.wisc.edu/wxwise/contour/contour1.html
Latest revision: 27 July 2004 (0205 UTC)
Produced by Edward J. Hopkins, Ph.D. Department of Atmospheric and Oceanic Sciences University of Wisconsin-Madison, Madison, WI 53706 hopkins@meteor.wisc.eduURL Address: aos100/homework/s04hmk05-0.html