Current AMM State:
The figure above shows the following:
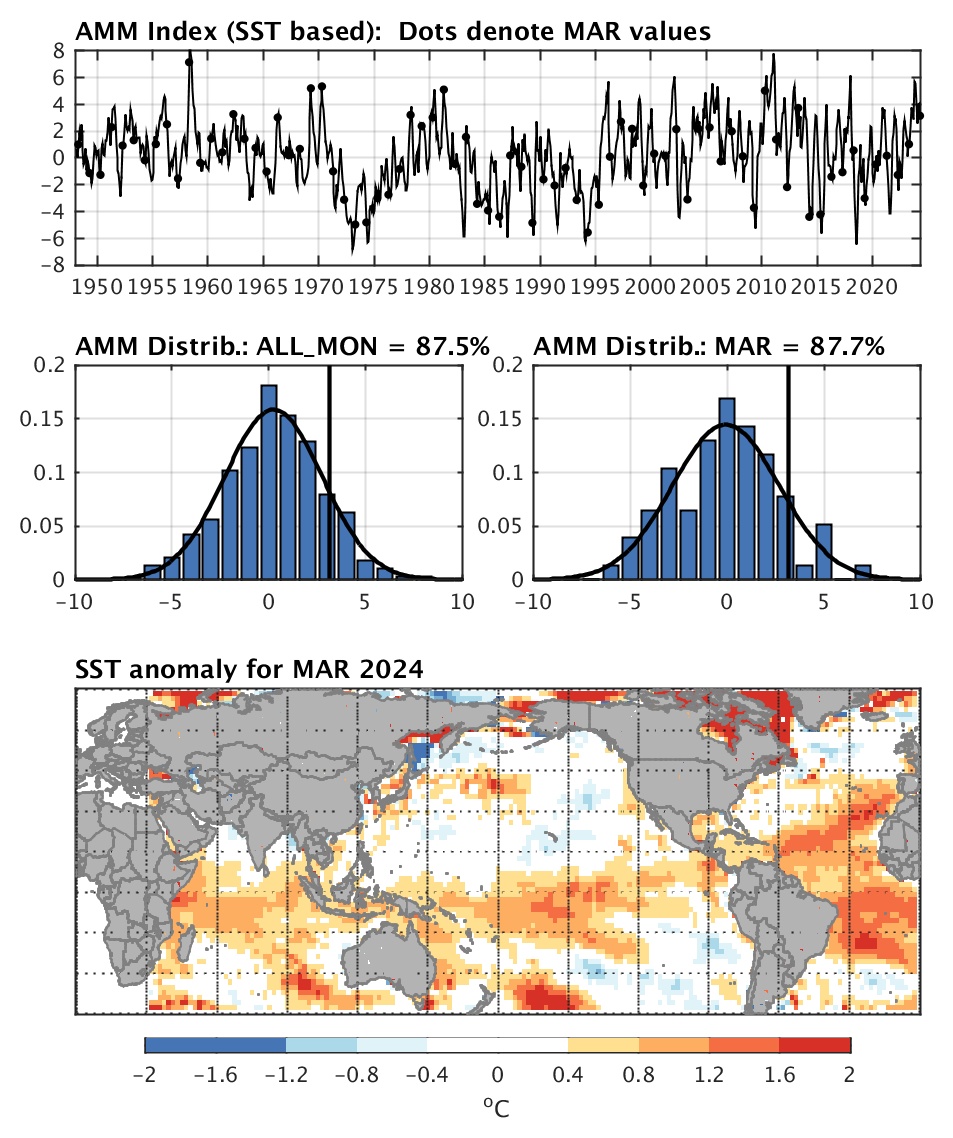
Top panel: The current monthly AMM SST time series is plotted as a black line with dots representing the historical evolution of the current calendar month (e.g. January values only, February values only, etc.).
Middle panels: Histograms of all monthly AMM SST time series values (left) and only the current calendar month’s AMM SST time series values (right) are plotted, together with the normal distribution approximation to the time series (black curve). A vertical black line indicates the present month’s AMM value, and it’s percentile among all months (left) and for the current calendar month (right) is listed.
The bottom panel shows the current month’s SST anomaly from the NCEP reanalysis and is plotted for reference.
Technical Description:
The Atlantic Meridional Mode is defined as the leading mode of non-ENSO coupled ocean / atmosphere variability in the Atlantic basin. The realtime AMM index is defined following the method of Chiang and Vimont (2004). The AMM spatial structure is defined via applying Maximum Covariance Analysis (MCA; Bretherton et al. 1992) is to tropical Atlantic SST and 10m winds over ocean regions between 75E and 15W, 21S to 32N. Data are obtained from the NCEP-NCAR Reanalysis (Kalnay et al. 1996), from NOAA ESRL. The spatial resolution is reduced by averaging three points in the zonal direction, and two points in the latitudinal direction, resulting in approximately 3.8deg latitude by 5.6deg longitude resolution over the region. Next, the seasonal cycle is removed, data are detrended, a three month running mean is applied to the data, and the equatorial Pacific Cold Tongue Index (SST averaged over 180-90W, 6S-6N) is removed (via linear regression) from all points. Finally, the data are weighted by the square root of the cosine of latitude, and the covariance matrix is formed between SST and winds (note the wind fields are appended to each other so the wind state vector has twice as many points as the SST state vector). The covariance matrix is decomposed via Singular Value Decomposition, and the leading statistical mode form the AMM SST and Wind patterns. The time period over which the patterns are computed is frozen as the 1950-2005 time period so that the patterns do not change as the index is being updated.
Two time series are provided: AMM and AMM_RAW. Both are constructed by projecting the spatial patterns defined above onto the SST or wind field. For the AMM time series, all operations described above EXCEPT the three month running mean are applied to the SST and wind data sets prior to projecting the data onto the spatial patterns. For the AMM_RAW time series, none of the operations above are performed (except removal of the seaonal cycle, and area weighting by the square root of the cosine of latitude prior to projecting the pattern onto the data). The AMM time series (in contrast to the AMM_RAW) time series is therefore more “independent” of ENSO (though it is not fully independent of ENSO).
In general, it makes more sense to use the SST index for the AMM as that index is more representative of the coupled mode. The wind index mixes both the coupled atmospheric component of the AMM and external forcing that drives the AMM in the first place. See Chiang and Vimont (2004) for more detail.
The Atlantic Meridional Mode
You may download versions of the above figure here. A description of what is shown is also listed below. If you use these figures in a presentation or link to them on a website, please acknowledge this website.
amm_current.pdf (PDF version of the above figure)
amm_current.jpg (JPG version of the above figure)
amm_current.eps (EPS version of the above figure)