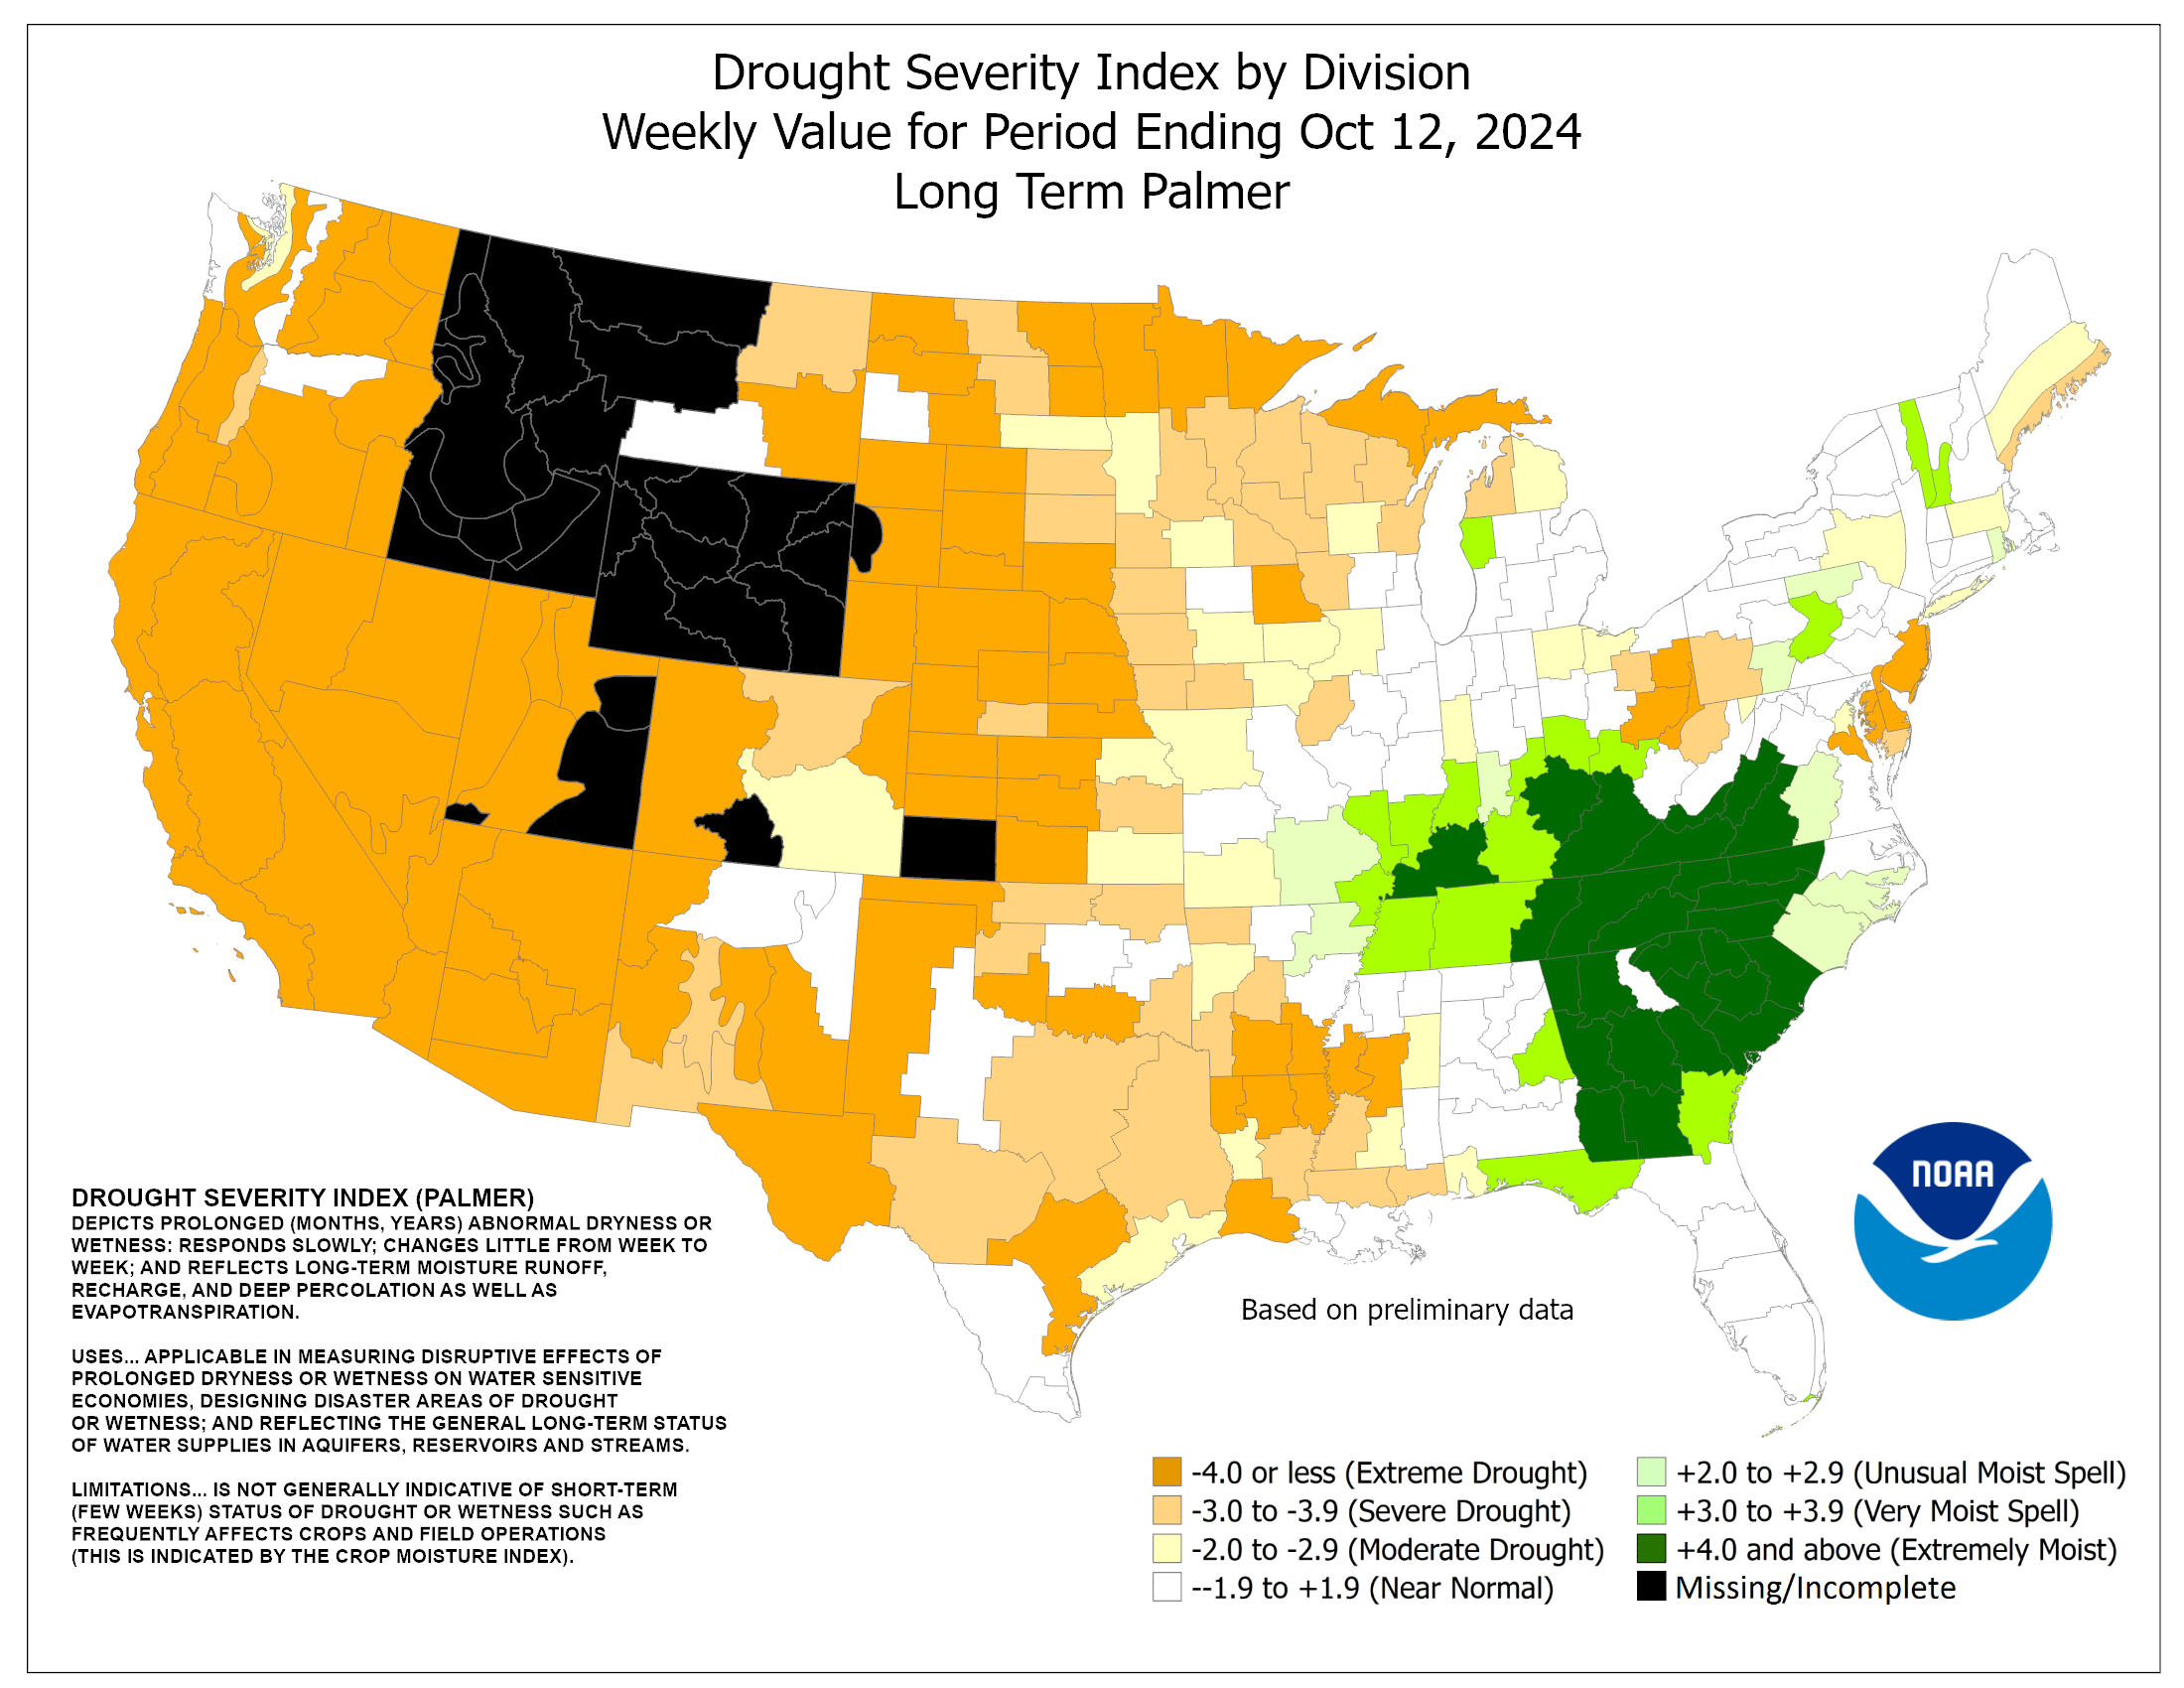
During the past year, severe to exceptional drought conditions across much of the nation has ameliorated, leaving moderate to severe drought across sections of the West and Upper Midwest. Continued drought across the West along with wet conditions across the nation's midsection will impact the soil moisture available to growing crops, an important factor as we enter the 2010 agricultural season. One could inspect the tables of monthly precipitation (in hundredths of an inch) that are furnished by the National Weather Service several days after the conclusion of each month for nearly 250 selected U.S. cities. These monthly precipitation totals were compared with averages from the 1971-2000 climatological reference interval. Precipitation across sections of the northern Plains during January 2011 was well above average, while many sections of the nation from the Southwest to the Mid-South and the Atlantic Seaboard had below average January precipitation,
What constitutes a drought? The answer depends upon whom you ask. At least four types of drought can be defined. To the farmer, an agricultural drought represents an extended interval with a serious soil moisture deficiency during critical crop growth periods. A hydrologist would classify a hydrological drought as an extended interval containing abnormally low stream flow, lake levels and ground water reservoirs. Most meteorologists would consider a meteorological drought to occur when the accumulated precipitation is well below a prescribed amount that would depend upon the region or season. A fourth type would be socioeconomic drought, where the shortage of water affects humans, typically in terms of economic activities. Economic goods that may be affected may include water, agricultural food products and hydroelectric power.
Typically, the severity of a drought depends upon the lack of soil moisture, which is influenced by one or more of the following factors to include a lack of precipitation, low atmospheric humidity, high air temperature, strong winds, a lack of clouds and intense sunlight. In addition, the drought severity depends upon its duration and the size of the affected area.
The start of a drought usually is subtle in that few can tell when a spell of dry weather really constitutes the incipient phase of a drought. Similarly, the end of a drought is also difficult to assess, since one rain event does not necessarily "break a drought". The National Weather Service uses several indices to assess the severity of a drought. One of the most frequently used drought indices is the Palmer Drought Severity Index developed by Wayne Palmer in the 1960s. This Palmer Index incorporates temperature and rainfall information in a formula to determine abnormal dryness or wetness over prolonged time intervals, such as a month to years. The National Weather Service and U.S. Department of Agriculture jointly compute the Drought Index weekly for each of 344 climatological divisions across the United States. A map of the current Drought Index is available that shows those divisions experiencing drought with negative index values and varying shades of red, while those regions with excess precipitation have positive values and varying shades of green.
The most recent map (weekly index values ending 12 February 2011) shows moderate to extreme drought limited to a few scattered sections of the lower Mississippi Valley and in Maryland. On the other hand, unusually moist to extremely moist conditions prevailed across the Pacific Northwest, the Intermountain West, the northern Plains, the Upper Mississippi Valley and the Northeast. Near normal soil moisture conditions according to the long-term Palmer Drought Severity Index prevailed over the remainder of the nation.
In the last several years, the National Drought Mitigation Center, a group consisting of several governmental agencies along with the University of Nebraska-Lincoln, has maintained a Drought Monitor site that provides weekly updates of current drought information and forecasts of the potential for drought across the nation. Their current summary map of drought conditions attempts to improve upon the Palmer Drought Severity Index and synthesize five other indices, together with a certain amount of subjectivity to arrive at six drought severity categories. They attempt to show the impacts of the drought upon agriculture and wildfire potential. Their most recent map (15 February 2011) shows moderate to severe agricultural and hydrological drought extending across scattered areas of the southern tier of states, extending from the Arizona eastward to the Atlantic Seaboard and northward into the central Plains and the Ohio Valley. An accompanying narrative entitled "National Drought Summary" also provides a five-day forecast and a 6- to 10-day outlook for precipitation and temperature across the country. This site also includes animated Drought Monitor maps for the prior six and twelve weeks. The Drought Impact Reporter is an interactive tool that permits exploration of the reported drought impacts across the nation. The goal is to help in risk management that could ultimately help shape drought related policy at the state and federal levels.
The US Seasonal Drought Outlook released on 17 February 2011 by NOAA's Climate Prediction Center and valid for meteorological spring (March through May) 2011 indicates that drought conditions were expected to develop or persist across the southern tier of states, southern tier of states, extending from Arizona eastward to Florida and northward into western Nebraska in the Plains and to New Jersey along the Atlantic Seaboard. They also indicated that improvement in the drought conditions could be anticipated across sections of the Midwest and the Mid-South, primarily in the Ohio and Mississippi Valleys.
Palmer, W.C., 1988 (12 Jul): The Palmer Drought Index: When and how it was developed. Weekly Weather and Crop Bulletin, 75 (28), 5.
Return to DataStreme ECS website
Prepared by Edward J. Hopkins, Ph.D., email hopkins@meteor.wisc.edu
© Copyright, 2011, The American Meteorological Society.