WEEKLY CLIMATE NEWS
WEEK FIVE: 22-26 February 2016
ITEMS
OF INTEREST
- Spring is on the horizon -- Although meteorological spring (March through May) will not start for another week, spring has to be near, especially for baseball fans across northern sections of the nation as pitchers and catchers for most Major League Baseball clubs have reported for camps in Arizona and Florida.
- Monitoring the drought -- Read this
week's Supplemental Information...In
Greater Depth for information concerning assessing current
drought conditions across the nation.
- Longing for an ocean voyage? -- Applications are now being accepted for 5 upcoming expeditions on the scientific ocean drilling vessel, JOIDES Resolution! We are looking for creative, enthusiastic, flexible educators (both classroom and informal) and outreach/science communication types – including artists, videographers, writers and more. Information and links to the application are available here: joidesresolution.org/node/453. Application deadline is 10 March.
CURRENT
CLIMATE STATUS
- Record strong tropical cyclone in Southern Hemisphere -- Over this past weekend, Cyclone Winston became a major category 5 tropical cyclone on the Saffir-Simpson Scale as maximum sustained surface winds reached 185 mph with gusts to nearly 200 mph. According to Dr. Jeff Masters of Weather Underground, Winston has been rated the most powerful tropical cyclone to have developed in the Southern Hemisphere in recorded history. Winston made landfall on Fiji's island of Koro on Saturday evening (local time) at full strength as the second strongest landfall by any tropical cyclone in any ocean basin in recorded history; Super Typhoon Haiyan remains the strongest tropical cyclone with 190-mph sustained winds when it made landfall on the Philippine island of Samar in 2013.
[WunderBlog] Interestingly, Hurricane Patricia became the most intense tropical cyclone in either the North Atlantic and eastern North Pacific last fall as maximum sustained winds reached 215 mph as Patricia was located to the southwest of Manzanillo, Mexico.
[NOAA National Hurricane Center]
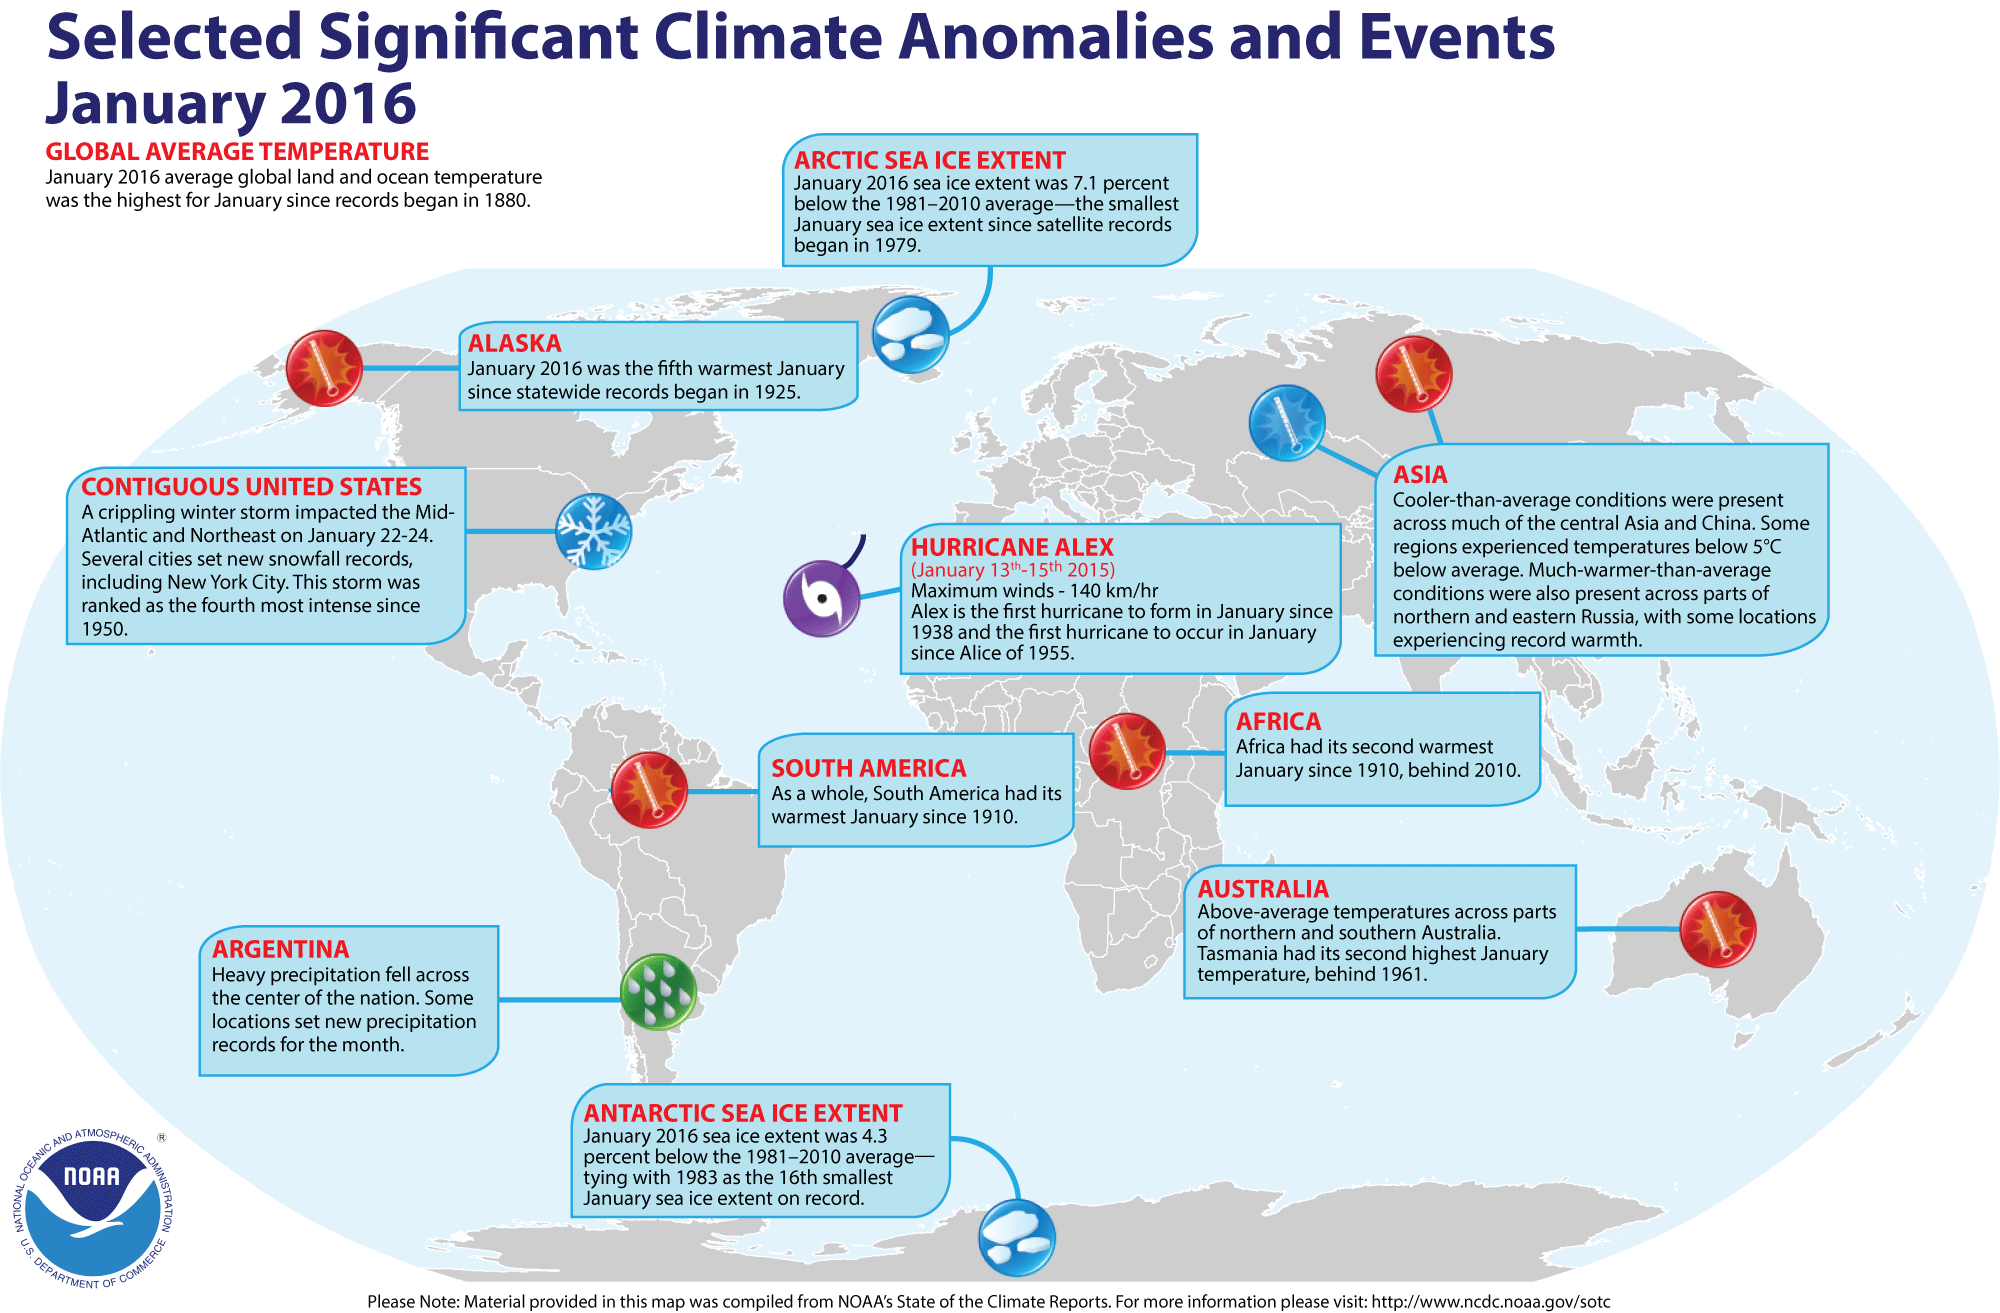
- Review of global weather
and climate for January 2016 -- Using preliminary data
collected from the global network of
surface weather stations, scientists at NOAA's National Centers for Environmental Information have determined that the combined global land and ocean surface
temperature for January 2016 was 1.87 Fahrenheit degrees (or 1.04 Celsius degrees) above the 20th-century (1901-2000) average, which makes last month the record highest global temperature for any
January since global climate records began in 1880. This reading exceeded the January 2007 temperature (1.55 Fahrenheit degrees or 0.86 Celsius degrees above the long-term average). The January 2016 ocean surface temperature was also the highest in the 137-year record, while the global land surface temperature for January 2016 was
second highest. The ocean surface remained warm despite continuation of the near-record strong El Niño event that created above average temperatures across the tropical Pacific. [NOAA/NCEI State of the
Climate]
According to the National Snow and Ice Data Center, the
extent of Arctic sea ice was the smallest monthly extent for any January since satellite surveillance began in 1979. Antarctic sea ice extent was slightly below average, tying 1983 for the 16th smallest January sea ice extent on record in the Southern Hemisphere.
The extent of the Northern Hemisphere snow cover during January 2016
was
the ninth largest for the period of record that
started in 1967. [NOAA/NCEI Global Snow & Ice]
NCEI also provides a map showing the Global Significant Weather and Climate Events map for January 2016.
- Monitoring Great Lakes ice cover -- An image made during the middle part of last week from the VIIRS sensor onboard the NOAA-NASA Suomi NPP satellite shows a relatively small amount of ice covering North America's Great Lakes. (Note that some of the white streamer-like features across several of the Lakes are lake-effect snow bands, produced by cold air flowing across the open and relatively warm lake surfaces.) [NOAA Environmental Visualization Laboratory] According to information furnished by NOAA's Great Lakes Environmental Research Laboratory, 23.7 percent of the Great Lakes were covered with ice at midweek this year as compared with over 80 percent during the last two relatively cold winter seasons (2013-14 and 2014-15). Lake water temperature maps are also furnished for the last three seasons. [NOAA GLERL]
- Southern Africa experiences a very dry "wet season" -- A large section of southern Africa that includes Mozambique, Zambia, Zimbabwe, South Africa and southern Madagascar has been experiencing the least amount of rainfall in the last 30 years during the normally "wet season" that extends from October through May. The lack of rain has destroyed crops, killed livestock and led to blackouts. The current strong El Niño event appears to be contributing to the drought conditions. [NOAA Climate.gov News]
A map based upon the analysis of vegetative health data across southern Africa collected by NOAA satellites during the second week of February shows the extent of drought conditions across the region. [NOAA Environmental Visualization Laboratory]
- The "warm blog" wanes -- A comparison of satellite-derived maps of the sea surface temperature (SST) anomalies, or differences in observed and long-term average SSTs from the months of July 2015 and January 2016, show a reduction in the size and magnitude of the anomalously warm pool of water in the eastern North Pacific Ocean called the "Blob" by a University of Washington meteorologist and Washington's state climatologist. This Blob appears to have been developed initially during the winter of 2013-14 by an unusually strong and persistent ridge of high pressure in the atmosphere over the northeastern Pacific Ocean that became known as the "Ridiculously Resilient Ridge." Recently, cooler surface waters have spread the northeastern Pacific, which has resulted in an apparent breakup of the Blob as of November 2015. [NASA Earth Observatory]
CURRENT
CLIMATE MONITORING
- Rising seas appear to be slowed by increasing water on land -- Scientists at NASA's Jet Propulsion Laboratory (JPL) and the University of California, Irvine claim that their analysis of new measurements obtained from NASA's Gravity Recovery and Climate Experiment (GRACE) twin satellites indicates that changes in weather and climate over the past decade have caused Earth's continents to absorb and store an extra 3.2 trillion tons of liquid water in soils, lakes and underground aquifers. The sequestering of the water in the soil each year, which would be equivalent to the volume of Lake Huron, would temporarily slow the rate of sea level rise by about 20 percent, which is associated with melting ice sheets and glaciers. [NASA Press Release]
- Improving the nation's Hurricane Database -- Staff from NOAA's National Hurricane Center have produced a blog detailing the efforts that have been made by them and their colleagues in the Best Track Change Committee to improve and extend the HURDAT (short for HURricane DATabase), a compilation of information on the position, intensity and type of tropical cyclones in the North Atlantic basin since 1851 and in the eastern North Pacific basins since 1949. This historical hurricane database supports a wide variety of uses in the research community, the private sector and the general public. ["Inside the Eye": Blog for NOAA's National Hurricane Center]
- National Stormwater Calculator --Climate Assessment tool is now online -- The U.S. Climate Resilience Toolkit, the website developed by NOAA and other Federal agencies as part of President Obama's Climate Action Plan, recently announced that the "National Stormwater Calculator" is now available for use online. This tool, which was developed by the US Environmental Protection Agency (EPA), is designed to assess the annual amount of rainwater and frequency of runoff from specific locations anywhere in the United States by anyone interested in reducing runoff from a property. A feature is included that permits exploration of the impacts of climate change. [US Climate Resilience Toolkit ]
PALEOCLIMATE
RECONSTRUCTION
- Gigantic Antarctic ice-shelf collapse followed last Ice Age -- A team of US and Japanese oceanographers recently reported that a large 100,000-square-mile section of Antarctica's Ice Shelf appears to have broken apart and disappeared within 1500 years during a warming period after the last Ice Age. Approximately 18,000 years ago, the ice shelf covered essentially the entire Ross Basin. The researchers based their findings on measurements of the large furrows gouged by the ice and sediments on the seafloor during a 56-day cruise in 2015 of the Ross Sea. [Rice University News]
- Presence of an Ice Age warm ocean water "blob" discovered in North Atlantic -- Scientists from the Arctic University of Norway's Centre for Arctic Gas Hydrate, Environment and Climate and Norway's Aarhus University claim that a pool of warm ocean surface water appears to have existed in the North Atlantic south of Greenland during the last Ice Age. During this time ice core records indicate that Greenland experienced several abrupt climate changes. [Centre for Arctic Gas Hydrate, Environment and Climate News]
- Atmospheric free oxygen was present earlier than previously assumed -- An international team of researchers recently reported that their studies of geological data from West Greenland indicate that small levels of atmospheric free oxygen developed by 3.8 billion years ago, which would be approximately 0.7-0.8 billion years earlier than previously thought during the Great Oxidation Event (ca 2.5-2.4 billion years ago). [University of Copenhagen News]
CLIMATE
FORECASTS
- Seasonal weather outlook released -- Late last week,
forecasters at the NOAA Climate Prediction Center released their new national Seasonal
Outlook for the next three months that consists of meteorological spring 2016 in the Northern Hemisphere (March-May). Specific details of their outlooks include:
- Temperature and precipitation outlooks -- According to their temperature outlook, the West Coast along with the northern tier of the 48 contiguous states running eastward to New England should experience a high chance of above average temperatures for Spring 2016. The greatest probability of unseasonably warm weather was to be found across the Pacific Northwest and along the US-Canadian border. On the other hand, sections of the southern high Plains and southern Rockies were considered to have a better than average chance of below average temperatures for these three upcoming months. West Texas would have the greatest chance of chilly weather. The outlook indicates that the remainder of the nation would have nearly equal chances of warmer or cooler than normal conditions.
Their precipitation outlook calls for most of the Florida Peninsula along with the Southwest to have a better than even chance of above average precipitation for Spring 2016.
In the Southwest, Arizona and the southern Rockies were considered to be under a better than even chance of above average precipitation. Conversely, sections of the Midwest centered on the Great Lakes along with a small area in the Northwest should have a better than even chance of below average precipitation. Elsewhere, a large area of the coterminous states should have essentially equal chances of below and above average precipitation for meteorological spring.
A summary of the prognostic discussion of the 3-month outlook for non-technical users is available from CPC. These forecasts were based in part on the chance that the major El Niño event should start weakening through Northern Hemisphere's meteorological spring (March-May), with a possible return to the current ENSO-neutral conditions (ENSO = El Niño/Southern Oscillation), where neither El Niño nor La Niña conditions prevail. The forecasters confidence on their outlook discussion for individual zones is given. A description is also provided as how to read these 3-class, 3-month Outlook maps.
- Seasonal Drought Outlook -- The
forecasters at NOAA's Climate Prediction Center also released their US
Seasonal Drought Outlook last week that would run from late-February through May 2016. Their outlook calls for the current drought conditions to persist across a large section of the interior Northwest, extending from northern California and Nevada into Oregon, Idaho and western Montana, as well as across sections of the Southwest running from southern California eastward across southern Nevada and into Arizona. Sections of central California and Nevada, along with scattered areas of Utah and the Rockies in Wyoming could experience improvement in drought conditions, with a few areas possibly being removed from drought classification.
Note: a Seasonal Drought Outlook Discussion is included describing the forecasters' confidence.
- Assessing how western groundwater would be affected by changing climate -- A team of 16 researchers from the US Geological Survey, the National Center for Atmospheric Research, NASA's Goddard Space Flight Center and several universities in several Western States and British Columbia foresees worsening of groundwater deficits in four economically important aquifers across the West by 2050. These deficits would create a precarious balance between usage and recharge. [University of Arizona News]
CLIMATE
AND THE BIOSPHERE
- Mapping ecosystem sensitivity to climate variability -- An international team of biologists have developed a new method for measuring ecosystem sensitivity to climate variability by using data collected by satellites between 2000 and 2013. The result of their research is a new indicator called the "Vegetation Sensitivity Index" (VSI) that quantitatively assesses how sensitive different ecosystems are to short-term climate anomalies. They have produced a global map of the VSI that depicts which areas are most sensitive to climate variability, which included "the Arctic tundra, parts of the boreal forest belt, the tropical rainforest, alpine regions worldwide, steppe and prairie regions of central Asia and North and South America, forests in South America, and eastern areas of Australia." [University of Bergen News]
CLIMATE
AND SOCIETY
- Research is conducted to improve wind forecasts for increased renewable energy reliance -- A NOAA meteorologist, Dr. Matt Brewer of the Air Resources Laboratory, was recently interviewed on the research that he and his colleagues conducted involving modeling wind patterns as part of the "Wind Forecast Improvement Project 2" (WFIP 2) in an effort to provide better short-term wind forecasts to the wind power industry. [NOAA Office of Oceanic & Atmospheric Research News]
- An All-Hazards Monitor -- This Web portal provides the user information from NOAA's National Weather Service, FAA and FEMA on
current environmental events that may pose as hazards such as tropical
weather, fire weather, marine weather, severe weather, drought and
floods. [NOAA/NWS Daily Briefing]
- Earthweek -- Diary of the Planet [earthweek.com]
Concept of the Week: Keeping your cool!
In order to survive, humans need to maintain a nearly constant
internal core temperature that is within several degrees of 98.6
degrees Fahrenheit. Your internal temperature depends upon an energy
balance involving the gain and loss of energy from radiation (incoming
solar versus incoming and outgoing infrared radiation), sensible heat
transfer (conduction and convection), latent heat of evaporation
(respiration and perspiration) and the body's metabolic rate. This heat
transfer depends upon the differences between skin temperature and the
ambient air temperature of the surroundings. In addition, wind and
atmospheric humidity can affect the rate of sensible and latent heat
transfer. Problems arise when either too much or too little heat flows
to or from the body, yielding hypothermia and hyperthermia (heat
stress) conditions, respectively.
When the air temperature increases, heat flow from the body is
often reduced. Heat flow can be increased to maintain stable
temperatures involuntarily by thermoregulatory processes such as
increased perspiration (sweating) and dilation of the blood vessels.
Humans can also act to prevent hyperthermia by selecting lightweight
and light colored clothes, as well as seeking of shade and well
ventilated locations. Unfortunately, high atmospheric humidity that
often accompanies high summer temperatures also reduces body heat loss
since evaporative cooling by perspiration is suppressed. During the
summer, the National Weather Service alerts the public of potentially
dangerous combinations of high air temperature and atmospheric humidity
levels by calculating the Heat Index.
Statistics kept by the National Weather Service reveals that
heat (along with high humidity) is responsible for the greatest number
of weather-related deaths across the nation during the 10-year period
(2001-2010), with 115 fatalities occurring per year. By comparison, 116
fatalities per annum are caused by tropical cyclones (hurricanes and
tropical storms), 56 deaths per year are associated from tornadoes and
25 deaths annually caused by the cold (low temperatures). (Note: The
large number of fatalities associated with the hurricanes of 2005,
which totaled 1016 deaths in the US due primarily to Hurricane Katrina,
has inflated the annual averages associated with tropical cyclones.)
Furthermore, concern has been raised that during this century, more
frequent and more severe heat waves due to global climate change could
become more common, leading to a greater risk of hyperthermia and,
ultimately, to higher morbidity rates.
Concept of the Week: Questions
(Each week you will be asked to respond to two questions
relating to that week's Concept of the Week topic.
Place your responses on the Chapter Progress Response Form provided in
the Study Guide.)
- The heat index is a function of air temperature and [(atmospheric
humidity),(wind speed),(sunshine
levels)].
- The annual number of fatalities across the nation in the
last ten years due to heat stress is approximately [(15),(60),(120)].
Historical Events:
- 22 February 1936...Although heat and dust prevailed in the
spring and summer, early 1936 brought record cold to parts of the U.S.
Sioux Center, IA reported 42 inches of snow on the ground, a state
record. (20th-22nd) (The
Weather Channel)
- 22 February 1996...Record heat continued over the
south-central states. All-time February high temperatures were set at
San Angelo, TX (97 degrees), Wichita Falls, TX (93 degrees), Oklahoma
City, OK (92 degrees), and Wichita, KS (87 degrees). (Intellicast)
- 23 February 1998...Otis, OR recorded its 79 straight day of
rain, the longest in the contiguous US. The streak began on 7 December
1997 (The Weather Doctor)
- 24 February 1905...The temperature at Valley Head, AL fell
to 18 degrees below zero, which was the lowest temperature ever
recorded in Alabama until January 1966. (Intellicast)
- 24-26 February 1910...Parts of Washington State were in the
midst of a storm that produced 129 inches of snow at Laconia between
the 24th and the 26th, a
single storm record for the state. A series of storms, which began on
the 23rd, led to a deadly avalanche on the first
of March. By late on the 28th, the snow had
changed to rain, setting the stage for disaster. (The Weather Channel)
- 24 February 1994...The Crystal Mountain ski resort in
Washington State recorded 65 inches of snow in a 24-hour period, the
state record for 24-hour snowfall. (Intellicast)
- 25 February 1914...South Carolina had its biggest snowstorm
in modern history, as 18 inches fell at Society Hill. (Intellicast)
- 25 February 1922...The temperature at Los Angeles, CA
soared to 92 degrees to establish a record for the month of February.
(David Ludlum)
- 26 February 1969...Both Portsmouth, NH and Portland, ME set
new single storm snowfall records with 33.8 inches and 26.9 inches,
respectively. (Intellicast)
- 27 February 1717...What was perhaps the greatest snow in
New England history commenced on this date. During a ten-day period, a
series of four snowstorms dumped three feet of snow upon Boston, and
the city was snowbound for two weeks. Up to six feet of snow was
reported farther to the north, and drifts covered many one-story homes.
(David Ludlum)
- 27 February 1988...Rapid City, SD established a February
record with an afternoon high of 75 degrees. (The National Weather
Summary) (Storm Data)
- 28 February 1900...A massive storm spread record snows from
Kansas to New York State. The 18.7 inches of snow measured at Topeka,
KS in 24 hours was the city's greatest 24-hour snowfall on record.
(David Ludlum) (Intellicast)
- 28-29 February 1964...A world 12-hour rainfall record was
set at Belouve, La Reunion Island in the western Indian Ocean when
52.76 inches of rain fell. World records for 9 hours and 18.5 hours
were also set with 42.79 and 66.49 inches, respectively. (Accord's
Weather Calendar) (The Weather Doctor)
- 28 February 1972...Unseasonably mild weather prevailed
throughout the central US. Temperatures soared to 83 degrees in Kansas
City, MO, setting an all-time high record for the month of February.
(Intellicast)
- 28 February 1988...Unseasonably mild weather prevailed in
the northwestern U.S. The afternoon high of 71 degrees at Portland, OR
was a February record. (The National Weather Summary) (Storm Data)
Return to DataStreme ECS RealTime Climate Portal
Prepared by Edward J. Hopkins, Ph.D., email hopkins@aos.wisc.edu
© Copyright, 2016, The American Meteorological Society.