WEEKLY CLIMATE NEWS
1-5 June 2015
DataStreme Earth Climate System will return for Fall 2015 with
new Investigations files starting during Preview Week, Monday, 24 August 2015. All the current online website products will continue to be available throughout the summer break period.
ITEMS
OF INTEREST
- Change in season -- Meteorological
summer in the Northern Hemisphere, the three-month span from June
through August, commences this Monday (1 June 2015). In three weeks, the summer solstice will occur on Sunday, 21 June, which marks the beginning of astronomical summer.
- Atlantic Hurricane Season begins -- The
hurricane season in the North Atlantic basin, including the Caribbean
Sea and the Gulf of Mexico will begin this Monday, 1 June. In
the Eastern North Pacific basin, the hurricane season began two weeks ago on 15 May.
The season will run until 30 November 2015 in both basins.
- High-quality maps of June temperature and precipitation normals across US available -- The PRISM Climate Group at Oregon State University's website has prepared high-resolution maps depicting the normal maximum, minimum and precipitation totals for June and other months across the 48 coterminous United States for the current 1981-2010 climate normals interval. These maps, with a 800-meter resolution, were produced using the PRISM (Parameter-elevation Regressions on Independent Slopes Model) climate mapping system.
- June weather calendar for a city near you -- The Midwestern Regional Climate Center maintains an interactive website that permits the public to produce a ready to print weather calendar for any given month of the year, such as April, at any of approximately 270 weather stations around the nation. (These stations are NOAA's ThreadEx stations.) The entries for each day of the month includes: Normal maximum temperature, normal minimum temperature, normal daily heating and cooling degree days, normal daily precipitation, record maximum temperature, record minimum temperature, and record daily precipitation; the current normals for 1981-2010.
- Early Sunrise -- Within the next week, many locations in the continental United States will experienced the date of earliest sunrise. While the longest daylight at each locale in the Northern Hemisphere will occur in over two weeks on the summer solstice (on Sunday, 21 June 2015), the occurrence of earliest local sunrise occurs before this date because the apparent sun now "leads" the clock time. This time discrepancy, which now amounts to approximately 2 minutes, occurs because of a combination of factors that result from the earth moving more slowly in its elliptical orbit because the earth presently is near its farthest point from the sun (aphelion on the afternoon of 6 July 2015) and the effect of the tilt of the earth's spin axis (near the summer solstice). For reference, the latest sunsets of the year will occur later in June as the apparent sun slows and by the first week of July "lags" clock time by about 4 minutes.
- Celebrating National Ocean Month -- A Presidential Proclamation has designated June as National Ocean Month. NOAA's National Ocean Service has a website entitled #30 Days of Ocean that provides links to a variety of websites containing facts, images and video designed to highlight both the beauty and importance of the nation's oceans and marine environment. Week 1 is titled "Our Amazing Ocean." [NOAA National Ocean Service]
- World Environment Day -- This
Friday, 5 June 2015, is World Environment Day (WED), a day that has been
created by the United Nations in an effort to stimulate worldwide
awareness of the environment and to enhance political attention and
action. This observance was established initially by the UN General
Assembly in 1972 to mark the opening of the Stockholm Conference on the
Human Environment. Various activities are being planned. This year's
theme for World Environment Day is "Seven Billion Dreams. One Planet. Consume with Care." [World Environment Day]
CURRENT
CLIMATE MONITORING
- Alaska experiences its earliest 90-degree day in over a century -- The cooperative weather observer at Eagle, AK reported a record high temperature of 91 degrees on the afternoon of 23 May 2015, which also established a new statewide record for the earliest occurrence of a 90-degree or higher temperature reading in a year since the 1890s.[NOAA Climate.gov News] NOTE: Record setting high temperatures were set elsewhere across Alaska and northwestern Canada. A map of the land surface temperature anomaly (arithmetic difference between observed and long-term average temperatures) for the third week of May generated from data obtained from the MODIS sensor onboard NASA's Terra satellite shows wide spread positive temperature anomalies (or above average temperatures) across a large section of interior Alaska and northwestern Canada. [NASA Earth Observatory]
- May 2015 is wettest month in Texas history -- The Texas State Climatologist recently reported that the nearly completed month of May 2015 has become the wettest month on record, as statewide average precipitation had reached 7.54 inches, surpassing the previous record of 6.66 inches in June 2004. A persistent flow pattern during much of the month that featured southerly low level flow from off the Gulf of Mexico and an active upper tropospheric jet stream across Texas were responsible for the heavy rains that essentially erased the drought conditions that had prevailed earlier in the year across most of the Lone Star State. [Texas A&M Today]
- Renowned United Kingdom's climate research center celebrates 25th anniversary -- The United Kingdom's Met Office Hadley Centre recently celebrated its 25th year of operation. This organization provides world-class guidance on the science of climate change and is the primary focus in the United Kingdom for climate science. One of the accomplishments of the Hadley Centre has been the maintenance of the highly-recognized global temperature datasets extending back to the mid-19th century. Highly sophisticated climate models have been developed here. [UK Met Office News]
CLIMATE FORCING
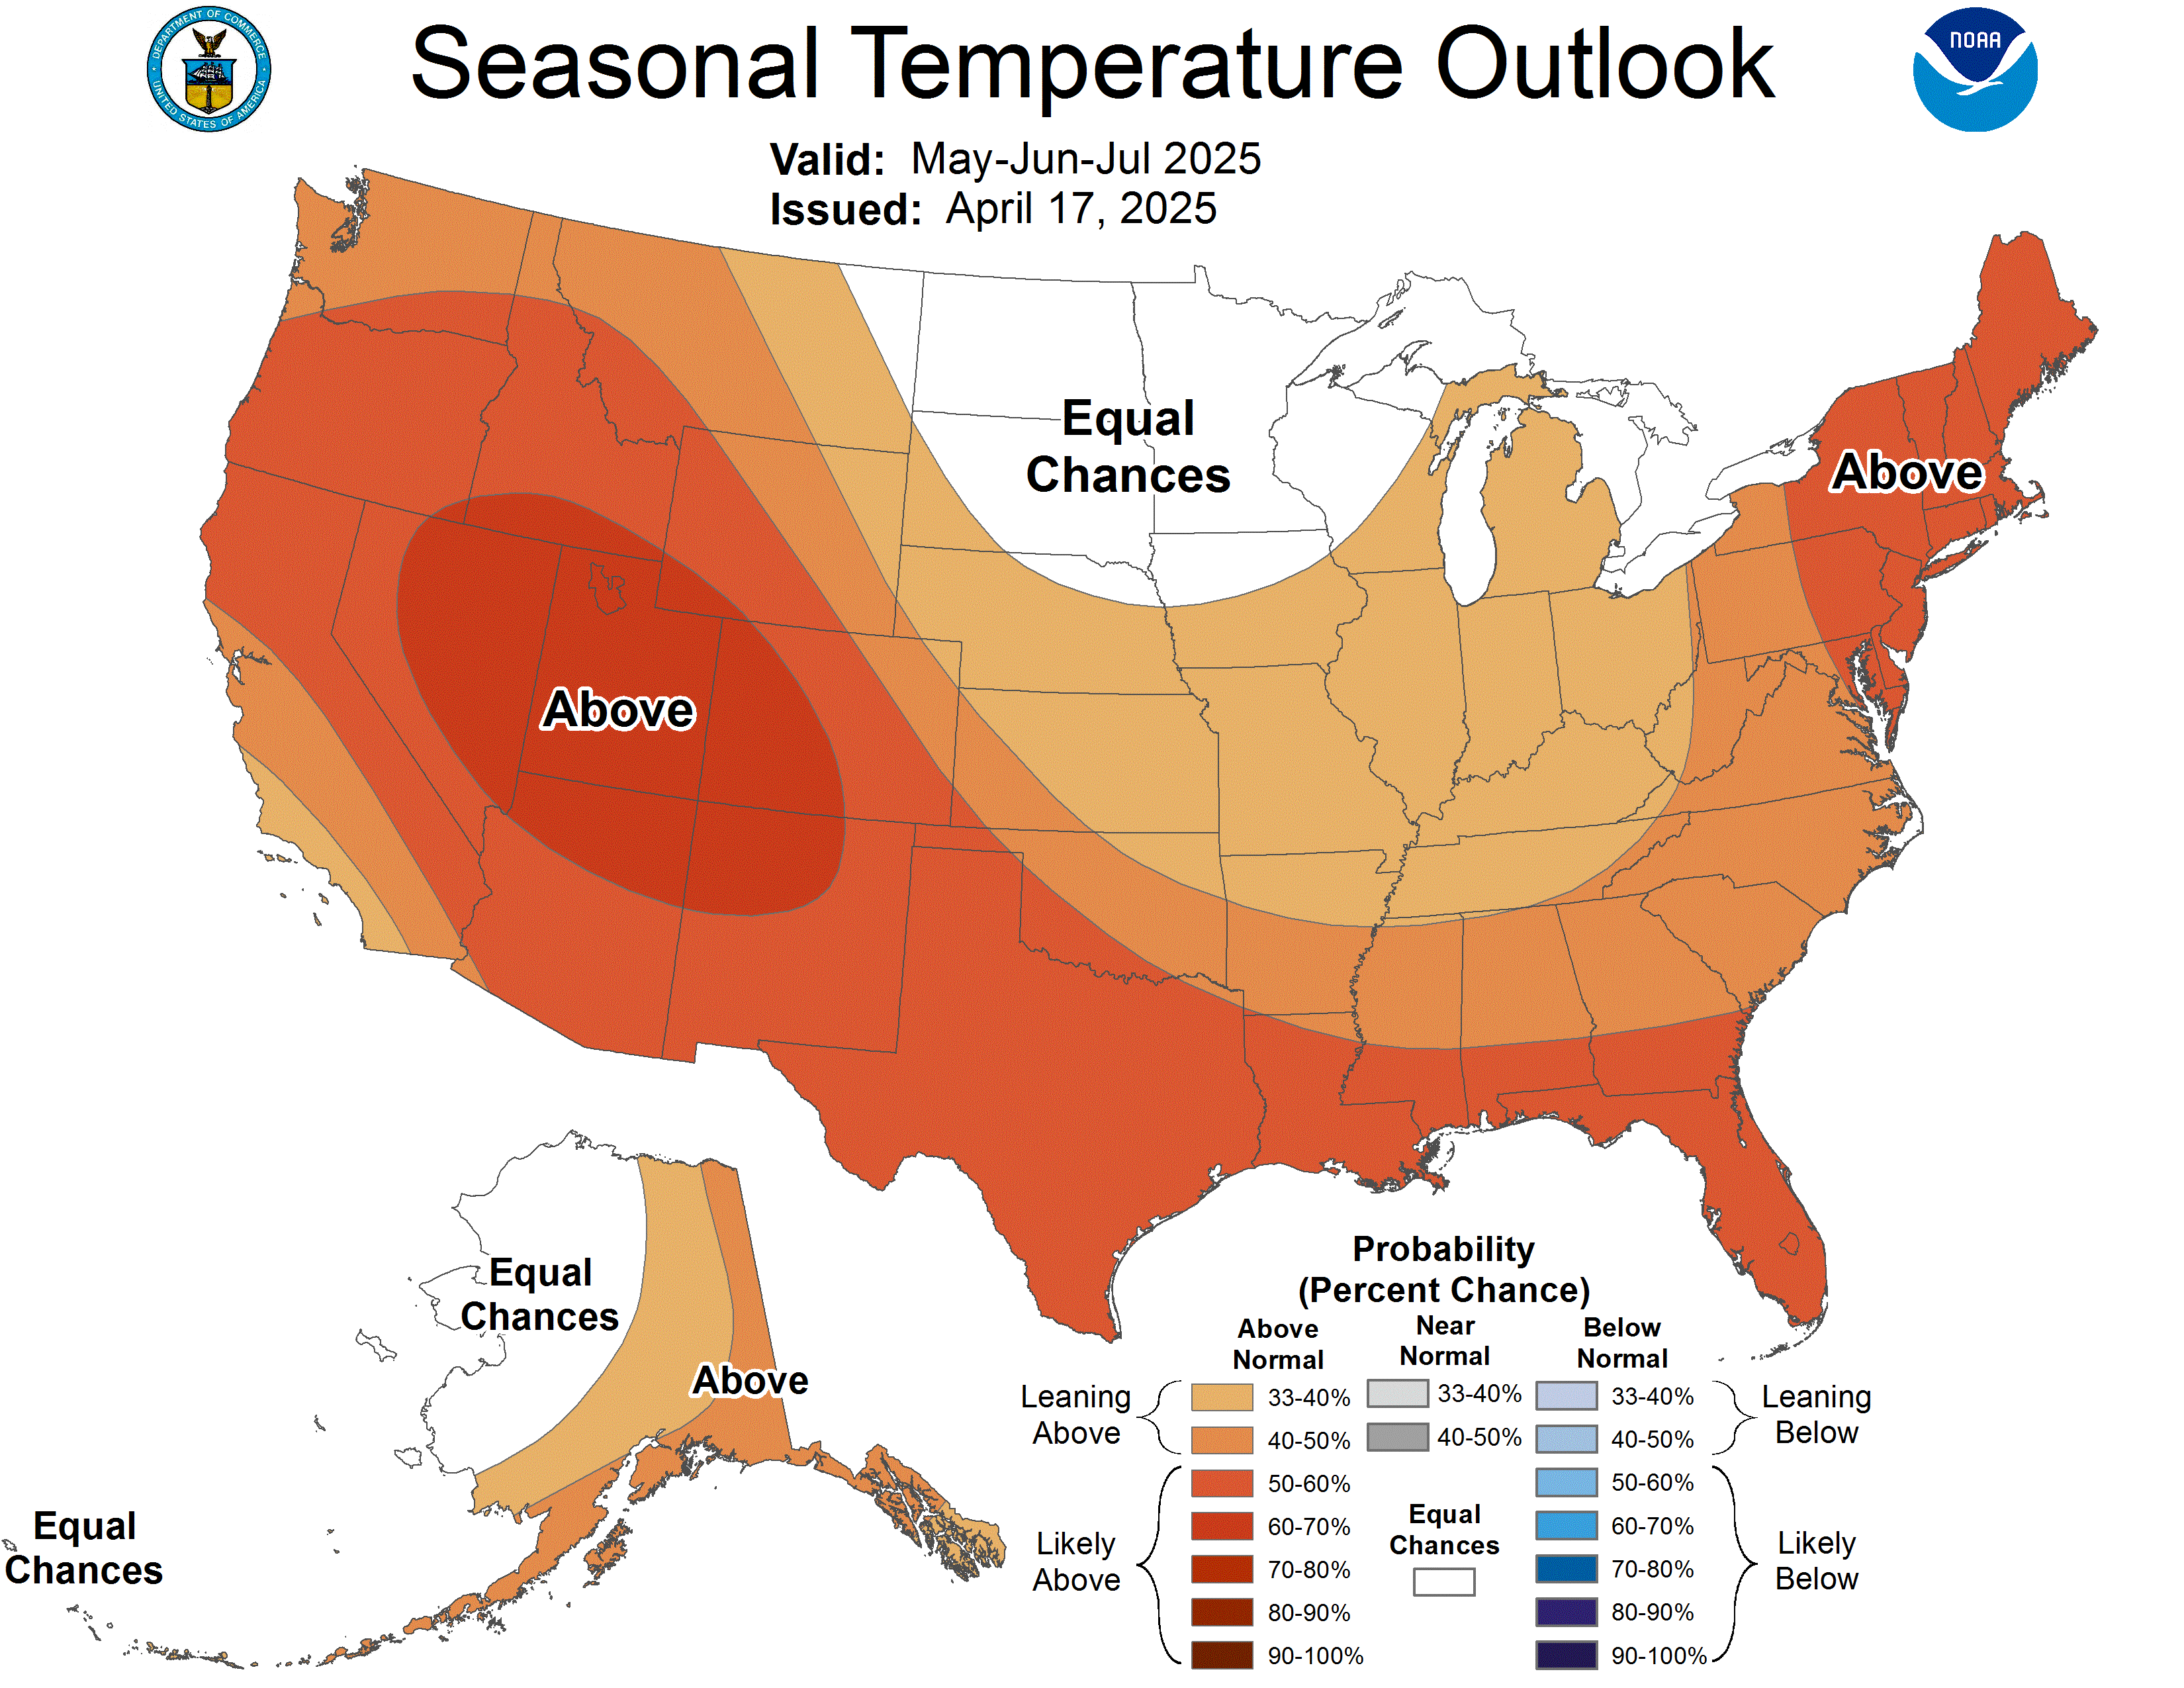
- Assessing impacts of El Niño event during boreal summer -- An ENSO (El Niño/Southern Oscillation) blog was posted that discusses the possible effects that the currently developing El Niño would have upon this upcoming summer's weather in the Northern Hemisphere. Focus is made upon the recent thee-month seasonal outlooks for the upcoming three-month summer season in the United States. Maps are provided describing the potential impact upon the winter season in the Southern Hemisphere. [NOAA Climate.gov News]
- Surface water temperature differences in eastern Pacific and western Atlantic basins at start of hurricane season -- A graphic generated by NOAA View shows a map of the sea surface temperature anomalies or departures (the arithmetic differences between observed and long-term average sea surface temperatures) across the eastern North Pacific and western North Atlantic (including the Caribbean Sea and the Gulf of Mexico) during the third week of May as obtained by NOAA's fleet of environmental satellites. The image clearly shows above average temperatures across the eastern equatorial Pacific associated with El Niño conditions that could lead to above-average tropical cyclone activity in the eastern North Pacific basin, while near average or slightly above average water temperatures were found in the Caribbean basin and sections of the western North Atlantic that would suggest a less active tropical cyclone season in that basin. [NOAA Environmental Visualization Laboratory]
CLIMATE FORECASTS
- Hurricane outlooks issued -- In
conjunction with National Hurricane Awareness Week, scientists with
NOAA's Climate Prediction Center released their outlooks for the
upcoming hurricane seasons in the Atlantic, the eastern Pacific and
central Pacific Basins:
- For the North Atlantic basin,
which includes the Caribbean
Sea and the Gulf of Mexico, the outlook indicates a 70-percent chance of a below-normal hurricane season in 2015 and a 20-percent chance of a near-normal season, with only a 10-percent chance of being above-average. Specifically,
the outlook calls for a 70-percent chance that the basin could
experience six to eleven named tropical cyclones (hurricanes and tropical
storms with sustained surface winds of at least 39 mph).
The forecasters also foresee that three to six tropical cyclones could become hurricanes (maximum sustained winds of 74 mph or higher). As many as two of these hurricanes could become
major hurricanes (Category 3 hurricanes or greater on the
Saffir-Simpson Hurricane Intensity Scale). These anticipated numbers would be below the long-term average of 12 named tropical
cyclones per year in the North Atlantic and the six hurricanes that normally form during each year. Three of these
hurricanes typically become major hurricanes. The forecasters
claim that the reduced tropical cyclone activity across the Atlantic basin is due to the presence of an El Niño event that should continue through the hurricane season. In addition, near average sea surface temperatures
found across the tropical Atlantic Ocean and the Caribbean Sea should limit hurricane activity. NOAA will issue an updated outlook
for the Atlantic hurricane season in early August, just before the
historical peak of the season. [NOAA
News]
- For the Eastern North Pacific basin (east
of 140 degrees West longitude), the outlook from NOAA's Climate
Prediction Center suggests a 70-percent chance of an above-normal season, a 25-percent chance of a near-normal season, and only a 5-percent chance of a below normal season. This outlook
would call for a 70-percent chance of the formation of between 15 and
22 named tropical cyclones, with seven to twelve hurricanes. Between five and eight
major hurricanes (category 3 or higher) were also envisioned. These
anticipated numbers compare with the 45-year average of 15 named
tropical cyclones per year that include eight hurricanes and as many as
four major hurricanes. The forecasters
indicate that the current
El
Niño event would enhance tropical cyclone activity across the region. [NOAA Climate Prediction Center]
- For the Central North Pacific basin (between
180 degrees and 140 degrees West longitude), forecasters at NOAA's
Central Pacific Hurricane Center in collaboration with their colleagues
at the Climate Prediction Center expect that the upcoming hurricane
season would have a 70-percent chance of above average normal activity and a 25-percent change of a near normal season. They called for five to eight tropical cyclones to
affect the central North Pacific in 2015, either forming with in the
basin or entering it from the Eastern Pacific. On average, four to five
tropical cyclones (including tropical depressions, tropical storms and
hurricanes) travel across the basin that stretches from 140 degrees
west longitude to the International Dateline. The forecasters
claim that the El
Niño conditions should result in more and stronger tropical cyclones across the basin.
[NOAA
Central Hurricane Center]
- For comparison, Phil Klotzbach and Bill Gray at Colorado
State University released a forecast of the 2015 Atlantic hurricane
season in early April that called for a relatively inactive season. They
envisioned seven named tropical cyclones, with three potentially becoming hurricanes. One of these hurricanes could become severe. [The
Tropical Meteorology Project]
In addition, forecasters at the United
Kingdom's Meteorological Office have recently produced a forecast
of the 2015 Atlantic hurricane season with below normal activity. These forecasters foresee between six and ten named tropical cyclones forming, with a most likely value of eight. The
forecasters feel that between three and seven hurricanes could form, with five being the
most likely value, which is one below the long-term average number. They base their estimates on the Accumulated Cyclone
Energy (ACE) index, which measures the number of storms and their
combined strength.
- Canadian national seasonal outlook issued -- Forecasters
with Environment Canada issued their outlooks for temperature and
precipitation across Canada for the three months of June, July and August
of 2015, which constitutes meteorological summer. The temperature outlook indicates that most of Canada south of the Arctic Circle along with the Yukon and Northwest Territories would experience above
normal (1981-2010) temperatures. In addition, sections of the Canadian Archipelago also could have above average summer temperatures. On the other hand, sections of Baffin Island and northern Quebec could have below average
temperatures for the next three months. Elsewhere across Canada, near
normal summer temperatures were anticipated.
The Canadian precipitation outlook for summer 2015 indicates that sections of British Columbia and the Prairie Provinces of Alberta and Saskatchewan could experience below average precipitation. Conversely, above average summer precipitation was possible across a few scattered sections of the nation, running from the Yukon Territory in the northwest to sections of Quebec in eastern Canada. Near normal precipitation for June through August was anticipated elsewhere.
[Note for comparisons
and continuity with the three-month seasonal outlooks of temperature and precipitation generated for the continental United States and Alaska by NOAA's
Climate Prediction Center, one would need to use Environment Canada's
probabilistic forecasts for temperature and precipitation.]
PALEOCLIMATE
RECONSTRUCTION
- Influx of icebergs into Atlantic raised tropical methane emissions during Pleistocene Ice Age -- Scientists at Oregon State University and the Desert Research Institute report that the large influx of freshwater into the North Atlantic Ocean from icebergs calving off North America during the last Ice Age appears to have increased the production of methane in the tropical wetlands. Apparently, the influx of cold freshwater altered rainfall patterns in tropical and subtropical latitudes, including the monsoon circulation regimes. The researchers based their findings on a nearly 60,000-year record of methane obtained from a highly detailed West Antarctic Ice Sheet Divide ice core. [Oregon State University News]
CLIMATE
MODELLING
- Drought conditions in California accelerated by hot weather -- Researchers from the University of California-Santa Barbara and the US Geological Survey running computer simulations on a hydrologic model have shown that abnormally high temperatures across California have played an important role in amplifying the effects of record low precipitation in making the current drought one of the worst droughts in California history. They showed that if air temperatures during the 2014 water year (October 2013 and September 2014) would be closer to long-term averages, then winter snowpack across the Sierras would have been greater, the spring-summer runoff higher, and the spring-summer soil moisture deficits smaller. [USGS Newsroom]
CLIMATE AND HUMAN HEALTH
- Lethal heat wave claims over 1100 lives in India -- A stifling heat wave that spread across the central states of India during the last two weeks of May has been responsible for more than 1100 fatalities across the region. Daytime temperatures ranged between 114 and 118 degrees (Fahrenheit), while nighttime low temperatures remained in the upper 80s and low 90s. The hot, sunny and dry conditions were expected to continue into the upcoming week before clouds and rains associated with the summer southwest monsoon season were expected to spread across the region. [CNN News]
CLIMATE AND SOCIETY
- Updated Extreme Weather Information Sheets for 2015 hurricane season available for coastal residents -- NOAA's National Centers for Environmental Information recently updated its NOAA Extreme Weather Information Sheets (NEWIS) for the upcoming Atlantic hurricane season. In addition, a sheet was also prepared for the state of Hawaii as the Central Pacific hurricane season is also beginning. These sheets, which can be downloaded, serve as a "one-stop" ready reference that provides critical information to coastal residents such as phone numbers and Web site information for contacting government officials and monitoring information resources. [NOAA National Centers for Environmental Information]
- Earthweek -- Diary of the Planet [earthweek.com] Requires Adobe Acrobat Reader.

Historical Events:
- 1 June 1907...Sarmiento, Argentina reported a temperature
of 29 degrees below zero, the lowest temperature ever recorded in South
America. (The Weather Doctor)
- 1 June 1941...Burlington, KS received 12.59 inches of rain,
which set a 24-hour precipitation record for the Jayhawk State. (NCDC)
- 1-17 June 2001...The deadliest and costliest tropical storm
in US history, Tropical Storm Allison, wandered westward across the
tropical Atlantic and crossed over into the Pacific before reversing
and moving back into the Caribbean and Gulf of Mexico. On 1 June the
tropical wave, which eventually evolved into TS Allison, moved into the
Gulf of Tehuantepec on the Pacific coast of Mexico after moving
westward across the tropical Atlantic and the Caribbean from the west
coast of Africa on 21 May. On the 2nd, a
cyclonic (counterclockwise) circulation developed to the
south-southeast of Salma Cruz, Mexico, but the low-level circulation
became ill defined as the system moved inland on the 3rd over southeastern Mexico and western Guatemala. This system intensified
again and eventually moved northward to the Texas Gulf Coast and then
eastward to the Atlantic before turning into an extratropical storm in
mid-June. (Accord's Weather Guide Calendar)
- 1 June 2005...The UV (ultraviolet) Index in Toronto,
Ontario reached 11 or Extreme on the 5-category UV
scale, marking the first time the new extreme category has ever been
attained in Canada. (The Weather Doctor)
- 2 June 1917...The temperature at Tribune, KS dipped to 30
degrees to establish a state record for the month of June. (The Weather
Channel)
- 3 June 1905...Seattle, WA received its heaviest ever
24-hour June rainstorm with 1.42 inches falling. (Intellicast)
- 4-5 June 1908...Helena, MT was deluged with 3.67 inches of
rain to establish their all-time 24-hour rainfall record. (The Weather
Channel)
- 5 June 1993...A strong, late season spring storm moved into
California. The 0.76 inches of rain at Los Angeles set a new daily
rainfall record for June. Lake Gregory was deluged with 3.24 inches of
rain in 24 hours and a foot of snow fell at the Mammoth Mountain ski
area. (Intellicast)
- 6-10 June 1816...The temperature reached 92 degrees at
Salem, MA during an early heat wave, but then plunged 49 degrees in 24
hours to commence the famous "year without a summer". Late season snow
fell across New England and eastern Canada. The editor of the Bangor
(ME) Register observed that individual snowflakes that fell
on Bangor during the afternoon of the 6th covered areas up to two inches in diameter. Snow fell near Quebec City,
Quebec over a 5-day period accumulating to 12 inches with "drifts
reaching the axel trees of carriages" during this infamous Year
Without a Summer. The Montreal Gazette reported that this "Extraordinary Season" gave snow squalls to the city
on the 6th and 8th. On
the 7th, a famous June snow fell in the
northeastern U.S. Danville, VT reported drifts of snow and sleet twenty
inches deep. The Highlands were white all day, and snow flurries were
observed as far south as Boston MA. Waltham, MA reported a low
temperature of 33 degrees and New Haven, CT had a low of 35 degrees
(David Ludlum) (Intellicast) (The Weather Doctor) (Accord's Weather
Guide Calendar)
- 6 June 1894...One of the greatest floods in U.S. history
occurred as the Willamette River overflowed to inundate half of the
business district of Portland, OR. (David Ludlum)
- 7 June 1972...Richmond, VA experienced its worst flood of
record as rains from Hurricane Agnes pushed the water level at the city
locks to a height of 36.5 feet, easily topping the previous record of
thirty feet set in 1771. (The Weather Channel)
Return to DataStreme
ECS website
Prepared by Edward J. Hopkins, Ph.D., email hopkins@meteor.wisc.edu
© Copyright, 2015, The American Meteorological Society.