WEEKLY CLIMATE NEWS
3-7 July 2017
DataStreme Earth Climate System will return for Fall 2017 with
new Investigations files starting during Preview Week, Monday, 21 August 2017. All the current online website products will continue to be available throughout the summer break period.
ITEMS
OF INTEREST
- Participate in Field Photo Weekends -- The public is invited to join thousands of other citizen scientists from across the nation in the Field Photo Weekend during the Fourth of July Weekend (1-4 July 2017) by taking six digital photographs at a place that you choose and submit these photos via a smart phone app or on-line with your computer. These photos, to be taken in the four cardinal directions (North, East, South and West), upward and downward, will be placed in the Geo-Referenced Field Photo Library, which is a community- and citizen- science data portal for people to share, visualize and archive geo-referenced photos from the fields in the world. Field Photo Weekend is a partnership between CoCoRaHS, the Southern Climate Impacts Planning Program (SCIPP) and the Earth Observation and Modeling Facility (EOMF)
By taking photos this weekend along with another Field Photo Weekend later this year (Labor Day weekends), one can begin to visualize seasonal changes in the local landscape. Similar Field Photo Weekends were held earlier this year on the Presidents' Day (18-20 Feb. 2017) and the Memorial Day (27-29 May 2017) Weekends.
- Way out there!...The earth reaches aphelion, the point in its annual orbit when it is farthest from the sun during the midday hours of Monday, 3 July 2017 (officially at 2011Z, which is equivalent to 4:11 PM EDT or 3:11 AM CDT, etc.). At aphelion, the earth-sun distance is 152,089,000 km, or 3.4% greater than the distance at perihelion, the smallest earth-sun distance, which occurred earlier this year during the early morning hours of 3 January 2018.
- Weather in Philadelphia for the 4th of July 1776--This
Tuesday is the 4th of July or Independence Day. Sean Potter, a
consulting meteorologist who has an interest in history, wrote an
article four years ago that describes the weather observations made
during July 1776 in Philadelphia by Thomas Jefferson who wrote the
Declaration of Independence. [Weatherwise
Magazine] Have a happy and safe 4th of July! EJH
- Using past records to assess chances of rain on the 4th of July -- An interactive map was produced by NOAA's National Centers for Environmental Information (NCEI). showing the historic probability of 0.10 inches or greater of rain falling on the 4th of July at over one thousand stations across the 48 contiguous United States. This map was produced from the 30 years of observations (1981-2010) at each of these stations. (Zoom in to any place across the nation to access more stations.) Maps of the historical chance of rain at stations in Alaska and Hawaii, along with additional information on the maps are available from the Beyond the Data blog posted by Deke Arndt, Chief of the Climate Monitoring Branch at NCEI.
- High-quality maps of July temperature and precipitation normals across US available -- The PRISM Climate Group at Oregon State University's website has prepared high-resolution maps depicting the normal maximum, minimum and precipitation totals for July and other months across the 48 coterminous United States for the current 1981-2010 climate normals interval. These maps, with a 800-meter resolution, were produced using the PRISM (Parameter-elevation Regressions on Independent Slopes Model) climate mapping system.
- July weather calendar for a city near you -- The Midwestern Regional Climate Center maintains an interactive website that permits the public to produce a ready to print weather calendar for any given month of the year, such as July, at any of approximately 270 weather stations around the nation. (These stations are NOAA's ThreadEx stations.) The entries for each day of the month includes: Normal maximum temperature, normal minimum temperature, normal daily heating and cooling degree days, normal daily precipitation, record maximum temperature, record minimum temperature, and record daily precipitation; the current normals for 1981-2010.
- The half-way point -- Midpoint of calendar year 2017 will occur at noon, local standard time, on Sunday, 2 July 2017.
- "Dog days" of summer begin -- The "Dog
Days" traditionally begin on the third day of July of each year and
continue through the eleventh day of August. The hot weather period
received its name from Sirius, the brightest visible star in the sky
and known as the Dog Star. Sirius rises in the east at the same time as
the sun this time of the year. (The Weather Channel)
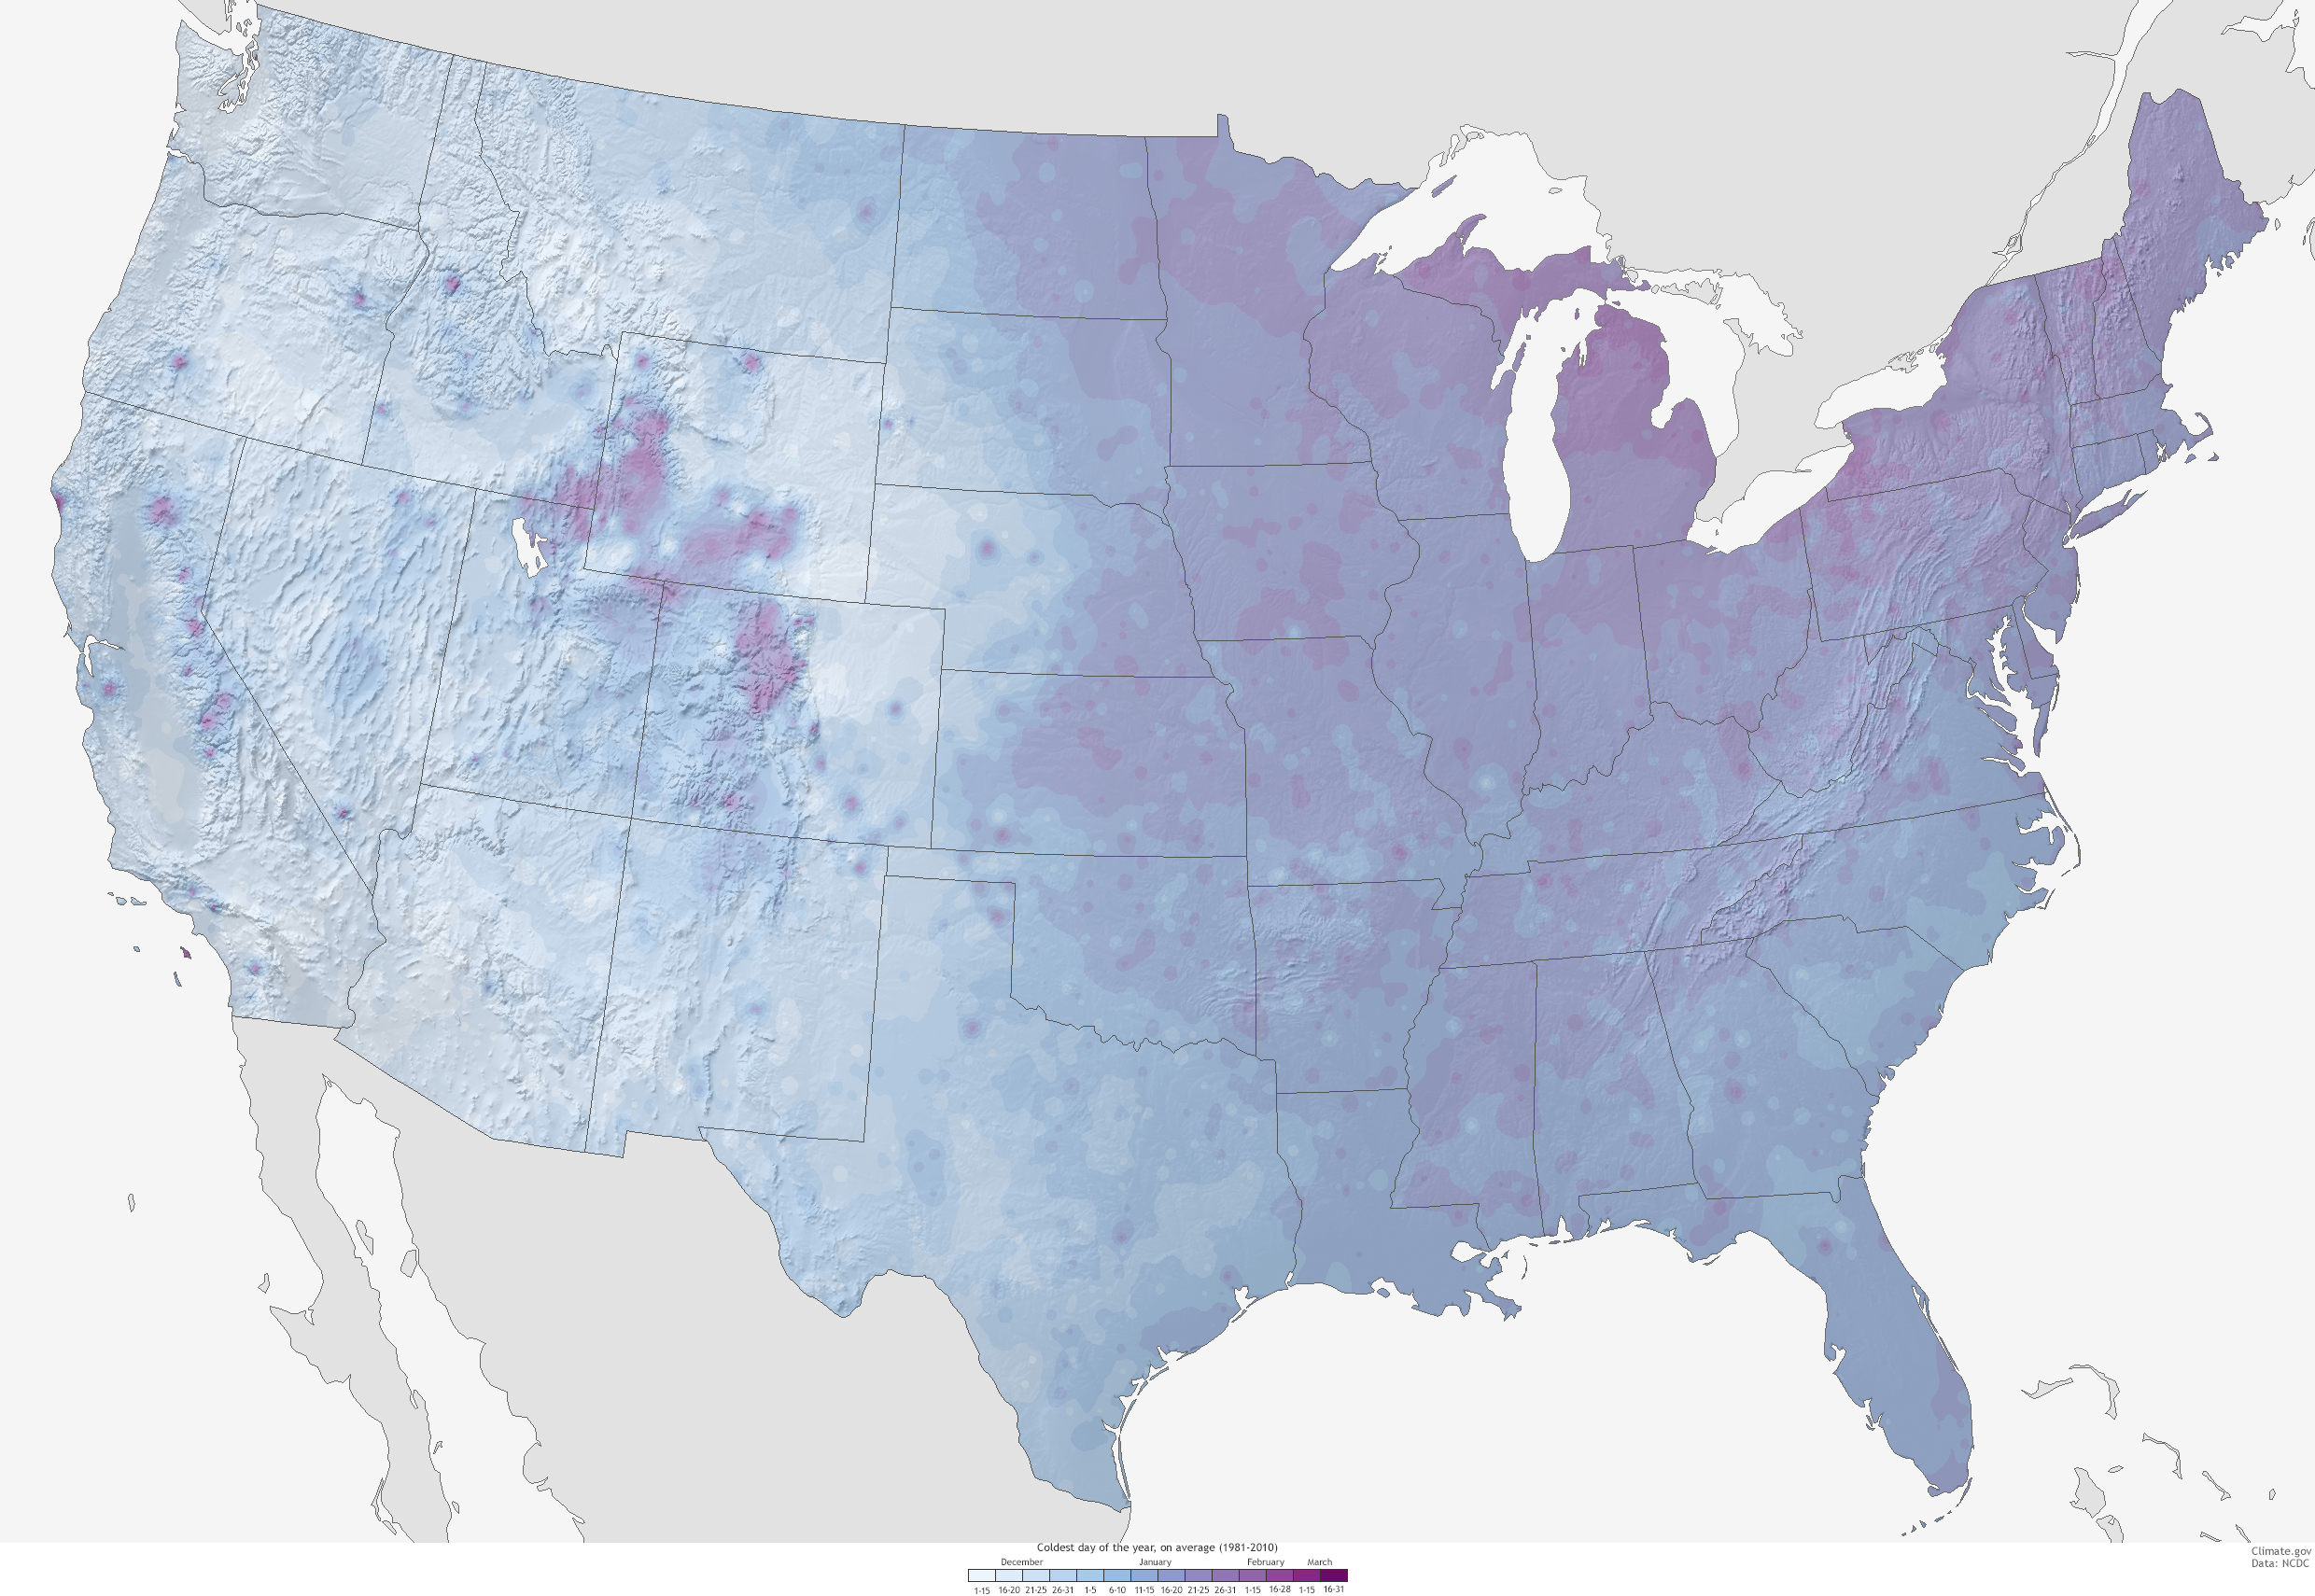
- "Warmest day of the year" approaches -- NOAA's National Centers for Environmental Information (formerly National Climatic Data Center) has created a "Warmest Day of the Year" map for the contiguous United States based upon the highest daily maximum temperatures of the year as calculated from the 1981-2010 climate normals. Additional maps are available for Alaska, Hawaii and Puerto Rico. Many places across the nation will experience their highest daily temperatures within the next two to three weeks. However, some locations in Arizona and New Mexico affected by the Southwest Monsoon reach their maximum temperatures during the last two weeks of June. On the other hand, coastal locations along the Pacific Ocean and in Hawaii would have the highest temperatures in September because of the thermal lag due to proximity of the ocean. [NOAA National Climatic Data Center News] Note: For comparison, a corresponding national map is available that shows the "Coldest Day of the Year" based upon the occurrence of the lowest daily minimum temperatures over the 1981-2010 climatological normals interval. [NOAA Climate.gov News]
- An AMS Education app is recognized as part of US Climate Resilience Toolkit -- The AMS Education Program Climate at a Glance Application entitled "Climate Variability or Climate Change?" https://www.ametsoc.org/amsedu/ecs/cag/ has been placed in the US Global Research Program's US Climate Resilience Toolkit at https://toolkit.climate.gov/tool/climate-glance-application. (Editor's note Thanks go to Dr. Ira Geer, AMS Education Program Director Emeritus, for providing these links to this app that he helped design. EJH)
CURRENT
CLIMATE MONITORING
- Upgrade of global weather and ocean observing system is planned -- In late May, NOAA officials met with ocean observations experts from six nations and 13 global organizations to plan for the redesign of the Tropical Pacific Observing System by the year 2020 (TPOS 2020). TPOS is an ocean-based monitoring network comprised of a variety of observing technologies, operated by NOAA and other foreign partners, designed to provide ocean data needed to understand important environmental phenomenon and to develop weather and climate forecasts for the US and countries around the world. The proposed enhancements to TPOS involve an optimization of buoy locations, the encouragement of more voluntary ship and research cruise observations, and the incorporation of new, more affordable ocean observing technologies. [NOAA Office of Oceanic & Atmospheric Research News]
- Earth's ozone layer may be threatened by another chemical -- British and American scientists have discovered that atmospheric concentrations of dichloromethane, a chemical not controlled by the Montreal Protocol to protect the Earth's ozone layer, appears to be increasing in concentration, posing a risk to this ozone layer. Dichloromethane is a chlorine-based industrial solvent and paint stripper. The scientists report that if dichloromethane concentrations continue to increase, some gains made under the Montreal Protocol could be offset, delaying the recovery of the ozone layer. [NOAA Office of Oceanic & Atmospheric Research News]
- Explaining the higher probability of severe weather at the time of the summer solstice -- A contractor for NOAA's Climate Program Office wrote an article for the ClimateNews Magazine describing the increase in the probability of severe weather across the contiguous United States from mid-to-late June, at the time of the summer solstice. A collection of maps is available that have been prepared by NOAA's Storm Prediction Center showing the historical probability of severe weather on a daily basis.
[NOAA Climate.gov News]
CLIMATE FORECASTS
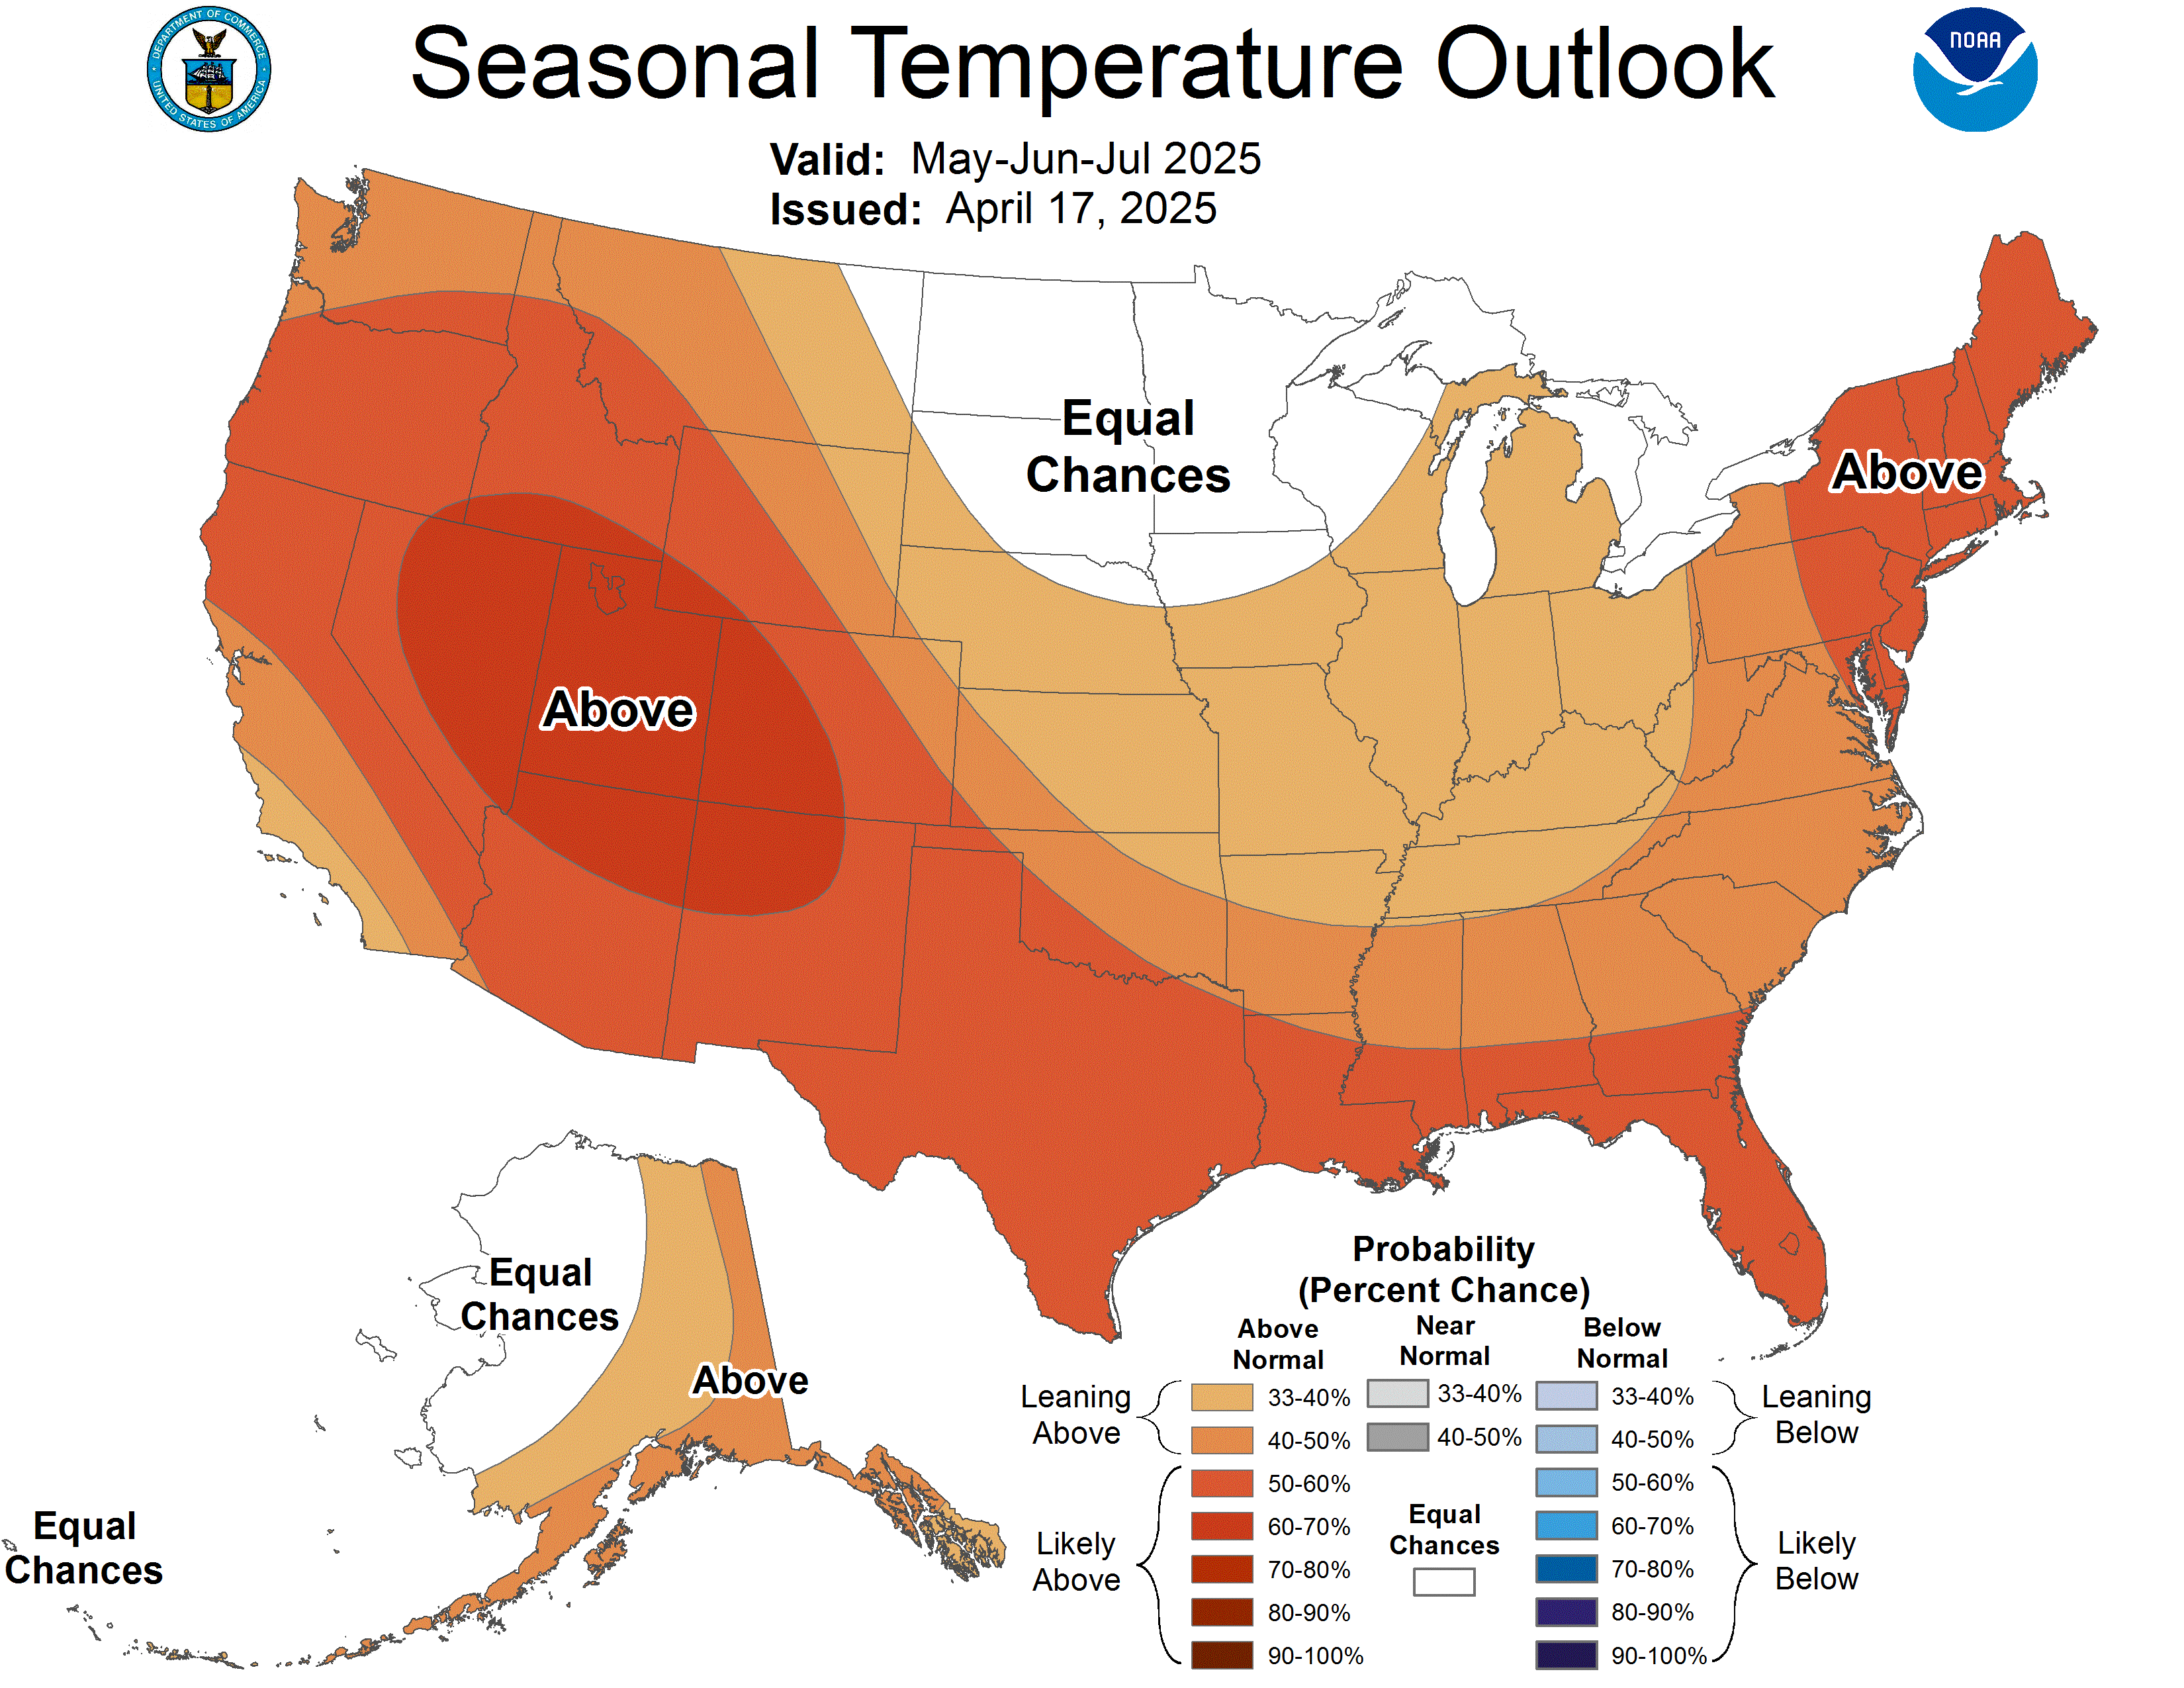
- Canadian national seasonal outlook issued -- Forecasters
with Environment Canada issued their outlooks for temperature and
precipitation across Canada for July, August and September 2017, which
represents the last two months of meteorological summer and the first
month of autumn. The temperature outlook indicates that most of Canada would experience above
normal (1981-2010) summer-early fall temperatures with only a few exceptions. Scattered areas along the eastern coast of Baffin Island were expected to have below normal summer
temperatures. In northern sections of the Canadian Archipelago, temperatures for the next three months should be close to normal.
The Canadian precipitation outlook for summer and early autumn 2017
indicates that below average
precipitation could be expected across a few widely scattered sections of Canada,
primarily across southern sections of British Columbia eastward to Saskatchewan, near the mouth of the St. Lawrence River and in as well as on Ellesmere Island in the Canadian Archipelago.
[Note for comparisons
and continuity with the three-month seasonal outlooks of temperature and precipitation generated for the continental United States and Alaska by NOAA's
Climate Prediction Center, one would need to use Environment Canada's
probabilistic forecasts for temperature and precipitation.]
CLIMATE AND THE BIOSPHERE
- A global drop in fires is detected over nearly two decades -- An international team of researchers have found that the total acreage burned by fires annually has declined by approximately 24 percent between 1998 and 2015. They obtained these statistics from data collected from MODIS instruments on NASA's Terra and Aqua satellites that detected fires and burn scars. The decline in burned area was found to be greatest in savannas and grasslands of Asia and Africa and in the tropical forests of South America. These regions are found where fires are essential for maintaining healthy ecosystems and habitat conservation. According to one researcher, "climate change has increased fire risk in many regions, but satellite burned area data show that human activity has effectively counterbalanced that climate risk, especially across the global tropics." [NASA Earth Observatory]
In a separate study, researchers from Vrije Universiteit Amsterdam, the Woods Hole Research Center and NASA's Jet Propulsion Laboratory have found that the number of lightning induced fires in the boreal forests in Alaska and Canada's Northwest Territories has increased by between two and five percent per year since 1975. An increase in the number of thunderstorms due to changing climate conditions appear to be responsible for the increased lightning that was igniting the boreal forests. [NASA Jet Propulsion Laboratory Feature]
CLIMATE
AND SOCIETY
Historical Events:
- 3 July 1975...Shangdi, Nei Monggol, China received 401 mm
(15.78 inches) of rain, the greatest 1-hour rainfall ever recorded on
Earth: (The Weather Doctor)
- 3 July 1966...The northeastern U.S. was in the midst of a
sweltering heat wave. The temperature at Philadelphia reached 104
degrees for a second day. Afternoon highs of 102 degrees at Hartford,
CT, 105 degrees at Allentown, PA, and 107 degrees at La Guardia Airport
in New York City established all-time records for those two locations.
(David Ludlum) (The Weather Channel)
- 3 July 1995...The lowest temperature ever recorded in New
Zealand was 6.9 degrees below zero at Ophir, New Zealand. (The Weather
Doctor)
- 4 July 1911...The northeastern U.S. experienced sweltering
100-degree heat. The temperature soared to 105 degrees at Vernon, VT
and North Bridgton, ME, and to 106 degrees at Nashua, NH, to establish
all-time records for those three states. Afternoon highs of 104 degrees
at Boston, MA, 104 at Albany, NY, and 103 at Portland, ME, were
all-time records for those three cities. (The Weather Channel)
- 4 July 1956...A world record for the most rain in one
minute was set at Unionville, MD with a downpour of 1.23 inches. (The
Weather Channel) (The National Severe Storms Forecast Center)
- 4 July 1989...Independence Day was "hot as a firecracker"
across parts of the country. Nineteen cities, mostly in the north
central U.S., reported record high temperatures for the date, including
Williston, ND with a reading of 107 degrees. In the southwestern U.S.,
highs of 93 at Alamosa, CO, 114 at Tucson, AZ, and 118 at Phoenix, AZ,
equaled all-time records for those locations. (The National Weather
Summary)
- 4 July 2007...The temperature at St.
George, UT hit an unofficial temperature reading of 118 degrees, which
would have topped the state's all-time record of 117 degrees, set in
St. George in 1985. (The Weather Doctor)
- 5 July 1925...An immense hailstone weighing 227 grams (0.5
lb) fell at Plumstead in London, England, the heaviest hailstone ever
recorded in the United Kingdom. (The Weather Doctor)
- 5 July 1936...The all-time state record high of 120 degrees
was set at Gann Valley, SD. (Intellicast)
- 5 July 1937...The temperature at Medicine Lake, MT soared to 117 degrees to tie the state record. Glendive, MT reached 117 degrees on 20 July 1893.
(National Weather Service files)
Midale and Yellow Grass in Saskatchewan hit 113 degrees to establish all-time record high temperatures for Canada that same day. (The Weather Channel)
- 5 July 1985...The temperature at St. George, UT reached 117
degrees, setting a record high temperature for the Beehive State.
(NCDC)
- 5 July 1986...The low temperature at Boise, ID dropped to a
crisp 35 degrees, the coldest ever for the month. (Intellicast)
- 5 July 1988...Afternoon and evening thunderstorms spawned
eleven tornadoes in Montana and three in North Dakota. Baseball size
hail was reported at Shonkin, MT, and wind gusts to 85 mph were
reported south of Fordville, ND. Twenty cities in the north central
U.S. reported record high temperatures for the date, including Fargo,
ND with a reading of 106 degrees. Muskegon, MI equaled their July
record with a high of 95 degrees. (The National Weather Summary) (Storm
Data)
- 5 July 1989...Moisture from what once was Tropical Storm
Allison triggered thunderstorms over the Middle Atlantic Coast Region,
which deluged Wilmington, DE with a record 6.83 inches of rain in 24
hours, including 6.37 inches in just six hours. Up to ten inches of
rain was reported at Claymont, northeast of Wilmington. July 1989 was
thus the wettest month in seventy years for Wilmington, with a total of
12.63 inches of rain. Alamosa, CO reported an all-time record high of
94 degrees, and Pierre, SD hit 113 degrees. Denver, CO reached 101
degrees, topping 100 for the second straight day, only happened once
before in 1972 (The National Weather Summary) (Storm Data)
(Intellicast)
- 5 July 1993...Heavy rains deluged the Central Plains as one
of the greatest floods in U.S. history began to unfold. Twenty-four
hour totals included 5.90 inches at Columbia, IA, 5.15 inches at
Centralia, KS and 4.80 inches at Haddam, KS. (Intellicast)
- 6 July 1928...A hailstorm at Potter, NE produced a stone
that was 5.5 inches in diameter, and seventeen inches in circumference,
weighing a pound and a half. At the time, it was the world's largest
hailstone. (David Ludlum) (Wikipedia)
- 6 July 1921...The mercury hit 104 degrees at Ville Marie,
Quebec, marking Quebec's highest temperature on record. (The Weather
Doctor)
- 6 July 1936...Steele, ND reached 121 degrees, the state
record. Moorhead, MN reached 114 degrees to set a record high
temperature for the Gopher State. (Intellicast) (NCDC).
- 6 July 1988...Thirty-six cities in the north central and
northeastern U.S. reported record high temperatures for the date.
Afternoon highs of 98 degrees at International Falls, MN and 101
degrees at Flint, MI equaled all-time records. Highs of 96 degrees at
Muskegon, MI and 97 degrees at Buffalo, NY were records for July. (The
National Weather Summary)
- 6 July 1994...An impressive 21.10 inches of rain fell at
Americus, GA to establish a 24-hour maximum precipitation record for
the Peach State. (NCDC)
- 7 July 1889...The greatest 20-minute rainfall ever recorded
on Earth occurred when 8.1 inches of rain fell on Curtea-de-Arges,
Romania. (The Weather Doctor)
- 7 July 1905...The mercury soared to 127 degrees at Parker, AZ to tie the state record established at Fort Mohave on 15 June 1896. The current record for Arizona is 128 degrees set at Lake Havasu City on 29 June 1994 (National Weather Service files).
- 7 July 1982...France's hottest day on record occurred at Le
Luc near St. Tropez when the high reached 108.9 degrees. (The Weather
Doctor)
- 7 July 1988...Thirty-eight cities in the north central and
northeastern U.S. reported record high temperatures for the date.
Youngstown, OH hit 100 degrees, and for the second day in a row, Flint,
MI reached 101 degrees, equaling all-time records for those two cities.
(The National Weather Summary)
- 8 July 1936...The temperature hit an all-time record high
of 106 degrees at the Central Park Observatory in New York City, a
record that lasted until La Guardia Airport hit 107 degrees on 3 July
1966. (The Weather Channel)
- 8 July 1989...Sixteen cities in the central and western
U.S. reported record high temperatures for the date. The high of 103
degrees at Denver, CO equaled their record for July, and a 110-degree
reading at Rapid City, SD equaled their all-time record high. Denver
reported a record five straight days of 100-degree heat, and
Scottsbluff, NE reported a record eight days in a row of 100 degree
weather. (The National Weather Summary)
- 8 July 2003...What may be the world's highest dew point temperature was recorded at Dhahran, Saudi Arabia, on the Persian Gulf. A dew point of 95 degrees was recorded at 3 PM while the air temperature was 108 degrees. The apparent temperature at that time would have been 172 degrees.(National Weather Service files)
- 9 July 1914...Finland's hottest day on record occurred when
the temperature at Turku, Finland reached 96.6 degrees. (The Weather
Doctor)
- 9 July 1950...The town of York, NE was deluged with 13.15
inches of rain in 24 hours to establish a record for the Cornhusker
State. (The Weather Channel)
- 9 July 1968...Columbus, MS received 15.68 inches of rain in
24 hours to establish a state record. (The Weather Channel)
- 9 July 1988...The percentage of total area in the country
in the grips of severe to extreme drought reached 43 percent, the
fourth highest total of record. The record of 61 percent occurred
during the summer of 1934. (The National Weather Summary)
Return to RealTime Climate Portal
Prepared by Edward J. Hopkins, Ph.D., email hopkins@aos.wisc.edu
© Copyright, 2017, The American Meteorological Society.