Weekly Ocean News
28 August - 1 September 2017
Items
of Interest:
- Another look at the "Great American Eclipse" from space -- A 40-second animation of high resolution natural-color images obtained from the new GOES-16 satellite last Monday (21 August) during the "Great American Eclipse" was produced by the University of Wisconsin-Madison's Space Science and Engineering Center. Note how a large dark shadow progresses from the Pacific Northwest to the east-southeast across the United States and exits out over the Southeast Atlantic Coast. [NASA Earth Observatory]
- Six NOAA back-to-school tools are ready for teachers -- The NOAA Education program has made six classroom-ready Earth science resource tools available to K-12 teachers in time for the start of the 2017-18 school year. These online digital resources and social media channels are intended to allow students to explore the Earth sciences, including the weather, ocean and climate sciences. [NOAA Stories]
- World Water Week in Stockholm is underway -- The 26th annual "World Water Week in Stockholm" is being held from Sunday 27 August through Friday 1 September in Stockholm, Sweden. This week-long global water conference, which is arranged by the Stockholm International Water Institute, addresses a wide range of the world's water, development and sustainability issues and related concerns of international development. This year's World Water Week Theme is "Water and Waste: Reduce and Reuse." [World Water Week in Stockholm]
- A change in seasons -- This Thursday, 31 August
2017,
marks the end of Northern Hemisphere's meteorological summer, the
three-month span of June, July and August that meteorologists
frequently use for record keeping processes. Meteorological autumn
(September, October and November) for the Northern Hemisphere starts
the following day, 1 September 2017.
Additional information will be presented in the next several weeks
concerning meteorological seasons and the astronomical seasons, such as
the familiar autumn season that begins on the autumnal equinox in three weeks
on Friday, 22 September 2017.
- Ocean charts, units, location and time -- Please
read this week's Supplemental
Information…In Greater Depth for a description of a several
types of oceanographic charts along with the definitions of some units
commonly used in ocean science to locate positions on the Earth's
surface and to identify time.
- September is National Preparedness Month -- The upcoming month of September has been declared National Preparedness Month (NPM), which is aims to educate and empower Americans to prepare for and respond to all types of emergencies, including natural disasters. NPM is managed and sponsored by the Federal Emergency Management Administration's (FEMA) Ready Campaign in conjunction with the Ad Council, A toolkit of marketing materials is provided to help promote the month and represents the lead on this campaign that was originally launched in 2004. The overarching theme for 2017 NPM is "Disasters Don’t Plan Ahead. You Can.," with an emphasis on preparedness for youth, older adults, and people with disabilities and others with access and functional needs.
Week 1 of the 2017 NPM starts at the end of the upcoming week (1- 9 September) with the theme of "Make a Plan for Yourself, Family and Friends."
[FEMA's Ready.gov]
- The historic Krakatau eruption of 1883 is remembered -- NOAA's National Centers for Environmental Information (NCEI) posted a feature describing the catastrophic eruption of the volcano on the island of Krakatau on 26 August 1883. The blast from this volcanic eruption on the island between Sumatra and Java, along with the series of lava and ash flows created immense tsunamis as high as 135 feet that propagated across the western Pacific Ocean and resulted in the destruction of hundreds of coastal villages on adjacent islands along with the deaths of approximately 36,000 people. A pressure shock wave was noted on barometers around the world. Large clouds of ash, dust and condensate were sent as high as 50 miles in altitude that darkened the skies and eventually resulted in the creation of a layer in the stratosphere (at altitudes between 10 and 50 km) that lowered the global air temperature by nearly one Fahrenheit degree over the next year. NCEI maintains a Volcanic Eruption Database that has more than 500 significant volcanic eruptions from around the world dating back to 1750. In addition, NCEI has data and information on global historical tsunami events. [NOAA NCEI News]
Ocean in
the News:
- Eye on the tropics --- Several named tropical cyclones (low pressure systems that form over tropical ocean waters, with near surface maximum sustained winds that intensify to tropical storm- or hurricane-force status) were found in the Atlantic and Pacific Ocean basins of the Northern Hemisphere during the past week:
- In the North Atlantic Basin (that also includes the Caribbean Sea and Gulf of Mexico), the remnants of former Tropical Storm Harvey regenerated into Tropical Depression Harvey on Wednesday morning
over the western Gulf of Mexico approximately 470 miles to the southeast of Port Mansfield, TX. Harvey rapidly intensified to a tropical storm by late Wednesday evening and then to become the third hurricane of 2017 in the North Atlantic basin by midday on Thursday. At that time, the center of Hurricane Harvey was moving toward the north-northwest as it was located approximately 340 miles to the southeast of Corpus Christi, TX. Over the next day and a half Hurricane Harvey continued to intensify to become a category 4 hurricane on the Saffir-Simpson Scale as it continued traveling to the north-northwest toward the Texas Gulf Coast. Hurricane Harvey made landfall between Port Aransas and Port O'Connor, TX late Friday evening with maximum sustained surface winds of 130 mph. In addition to the damage created in the Corpus Christi area due to hurricane-force winds and tornadoes, catastrophic flooding also occurred along the Texas coast due torrential rains and a storm surge produced by the onshore winds piling waters from the Gulf of Mexico onto the coast. Hurricane Harvey was the first major hurricane of category 4 status to make landfall along the US coast since Hurricane Charlie in 2004. After landfall, Hurricane Harvey slowed in its forward direction and slowly weakened to become a tropical storm by early Saturday afternoon. Over the next 24 hours the center of Tropical Storm traveled a relatively short distance. Due to this slow movement, torrential rains produced catastrophic flooding conditions along the Texas coast as between 12 to 27 inches of rain fell from the Corpus Christi to the Houston metropolitan areas. As of Sunday evening, the center of Tropical Storm Harvey was located approximately 20 miles to the east of Victoria, TX. Several fatalities have been reported because of Harvey. [CNN] Tropical Storm was forecast to maintain its strength as it would travel toward the southeast and east-southeast on Monday and Tuesday. Additional rainfall was anticipated over the next several days, with Houston possibly receiving 50 inches. The NASA Hurricane Page has additional information and satellite images for Tropical Storm Harvey.
NASA Earth Observatory also for satellite imagery animations of Hurricane Harvey approaching the Texas coast last Friday. In addition, a video is provided of the hurricane that made by the astronauts on the International Space Station.
- In the eastern North Pacific basin (east of the 140 degree West meridian of longitude), Hurricane Kenneth continued to intensify as it traveled to the west-northwest well off the western coast of Mexico at the start of last week. As of early Monday morning, this sixth hurricane in the eastern Pacific for 2017, had intensified to become a category 4 hurricane on the Saffir-Simpson Scale as maximum sustained surface winds had reached a satellite-estimated 130 mph. At that time Hurricane Kenneth was located 1355 miles to the west-southwest of Cabo San Lucas at the southern tip of Mexico's Baja California Peninsula. Curving slightly to take a track toward the northwest, Hurricane Kenneth slowly weakened over the next day and a half, before being downgraded to a tropical storm on Tuesday afternoon.
Kenneth became a post-tropical cyclone or remnant low on Wednesday afternoon 1625 miles west of Cabo San Lucas at the southern tip of Mexico's Baja California Peninsula.
Additional information and satellite imagery are available on Hurricane Kenneth on the NASA Hurricane Page.
- In the western North Pacific basin (to the west of the International Dateline), Tropical Storm Hato traveled to the west-northwest through the
Luzon Strait at the start of last week and then into the South China Sea. Hato rapidly intensified to become a category 2 typhoon on the Saffir-Simpson Scale as it approached the southeastern coast of China. Typhoon Hato made landfall late Wednesday (local time) approximately 80 miles to the west of Hong Kong, accompanied by torrential rain and strong winds that peaked at 115 mph just prior to landfall. Moving inland, Hato quickly weakened and then dissipated due to its travels over rough mountainous terrain.
The NASA Hurricane Page has satellite images and additional information for Hato.
Early last Friday (local time), another tropical storm formed from a tropical depression (identified as Tropical Depression 16W) in the Philippine Sea nearly 350 miles east-northeast of Manila, located on Luzon Island in the Philippines. Named Tropical Storm Pakhar, this system
traveled toward the west and then west-northwest as it crossed Luzon Island and then out over the South China Sea during this past weekend. As of late Sunday (local time), Tropical Storm Pakhar was situated approximately to the southwest of Hong Kong. Pakhar was expected to weaken and dissipate quickly as it moves on to the southeastern coast of mainland China. Additional information along with satellite images can be seen on the NASA Hurricane Page for Tropical Storm Pakhar (formerly TD-16W).
- Changes in ENSO forecasts impact the 2017 Atlantic seasonal hurricane forecasts -- The lead author of the Colorado State University's seasonal forecasts, Dr. Phil Klotzbach, recently wrote a guest post for the ENSO blog that describes how Atlantic seasonal hurricane forecasts are impacted by ENSO forecasts. (ENSO stands for El Niño-Southern Oscillation.) He notes that currently more than 20 long-range ENSO forecasts are currently available that are used by him and others, including NOAA and the University College-London, to make seasonal hurricane forecasts. These forecasters have recently investigated real-time forecast skill of seasonal Atlantic hurricane forecasts issued in April, late May/early June and early August between 2003 and 2015. They found limited skill in their April forecasts, moderate sill in early June forecasts and good skill in their August forecasts. Apparently, the skill increase was due to improvement in the skill of the ENSO predictions. Dr. Klotzbach directed attention to the changes in the ENSO forecasts during this current year. [NOAA Climate.gov News]
- Cruise begins to study environmental change in western Arctic Ocean -- At the end of last week a team of NOAA scientists and colleagues departed from Dutch Harbor, AK onboard the USS Coast Guard Cutter Healy on a 22-day cruise designed to study environmental change in the Bering, Chukchi and Beaufort seas off Alaska. The Healy will follow along the Distributed Biological Observatory (DBO), an array of instrumented buoys and other observing systems. Unmanned Saildrones have been deployed in July to help chart the course of the Healy. The scientists will track sea ice decline, increasing air and water temperature and ocean acidification. [NOAA Office of Oceanic & Atmospheric Research News]
- Global ocean carbon data placed into one repository -- NOAA's National Centers for Environmental Information (NCEI) recently created the "Ocean Carbon Data System" (OCADS), a data management project that is designed to place all ocean carbon data into one repository for use by scientists and other interested parties. The OCADS site contains ocean carbon measurements made from around the world from a variety of platforms, including research ships, commercial ships, and buoys. According to current estimates, the global oceans absorb approximately 26 percent of the carbon dioxide released into the atmosphere from both natural and human sources. Therefore, a knowledge of the cycling of carbon dioxide in the ocean is important for understanding climate and climate change. [NOAA NCEI News]
- Successful coral reef monitoring season in Caribbean is completed -- NOAA officials recently announced that two sampling missions that collected data from coral reefs in the waters around the US Virgin Islands this summer have been successfully completed. A multi-organizational task force collected the data on behalf of the agency's National Coral Reef Monitoring Program. [NOAA National Centers for Coastal Ocean Science News]
- Prospecting for oysters using a satellite -- Researchers from the University of Maine have been using data collected from instruments on NASA's Landsat 8 satellite to assist Maine seafood farmers in locating suitable locations in the waters of the Gulf of Maine where oyster farms should thrive. [NASA Earth Observatory]
- Arctic ice cores find changes in winter storm intensity are due to changing climate -- Ice cores that have been collected from mountain glaciers in Alaska and Canada's Yukon Territory by a team of researchers show that a dramatic change in the climate that began nearly 300 years ago has resulted in an increase in the intensity and duration of winter storms in the Arctic. A professor from Dartmouth University attributes the unprecedented increase in winter storms in Alaska to changes in weather patterns associated with a warming of the near-surface waters of the tropical Pacific Ocean. [Dartmouth University News]
- An All-Hazards Monitor -- This Web portal provides the user information from NOAA's National Weather Service, FAA and FEMA on
current environmental events that may pose as hazards such as tropical
weather, fire weather, marine weather, severe weather, drought and
floods. [NOAA/NWS Daily Briefing]
-
Earthweek -- Diary of the Planet
[earthweek.com]
Concept of the Week: Touring the
DataStreme Ocean Website
NOTE: This Concept for the Week is a repeat of that
which appeared in last week's Weekly Ocean News.
You are embarking on a study of
the world ocean and the role of the ocean in the Earth system. This
unique teacher enhancement course focuses on the flow and
transformations of energy and water into and out of the ocean, the
internal properties and circulation of the ocean, interactions between
the ocean and the other components of the Earth system, and the
human/societal impacts on and responses to those interactions.
Throughout this learning experience, you will be using the RealTime Ocean Portal to access and interpret a variety of
environmental information, including recent observational data. The
objective of this initial Concept of the Week is to
explore features of the RealTime Ocean Portal website.
On Monday of each week of the course, we will post the current Weekly Ocean News that includes Ocean in
the News (a summary listing of recent events related to the
ocean), Concept of the Week (an in-depth analysis
of some topic related to the ocean in the Earth system), and Historical
Events (a list of past events such as tsunamis or specific
advances in the understanding of oceanography). When appropriate, a
feature called Supplemental Information-In Greater Depth will be provided on some topic related to the principal theme of the
week.
You will use the RealTime Ocean Portal to
access and download the weekly "Current Ocean Studies" that complement Investigations found in your Ocean
Studies Investigations Manual. These materials should be
available Monday morning. Click the appropriate links to download and
print these electronic Current Ocean Studies and answer forms as well
as your Chapter Progress and Investigations Response forms.
The body of the RealTime Ocean Portal provides
links to the Earth System, information on Physical & Chemical,
Geological, and Biological aspects of the ocean, Atmosphere/Ocean
Interaction, the Great Lakes, and extras-a glossary of terms, maps and
educational links. Following each section is a link to other sites that
examine the various subsystems of the Earth system. Let's take a quick
tour to become more familiar with the RealTime Ocean Portal.
Under Physical & Chemical, click
on Sea
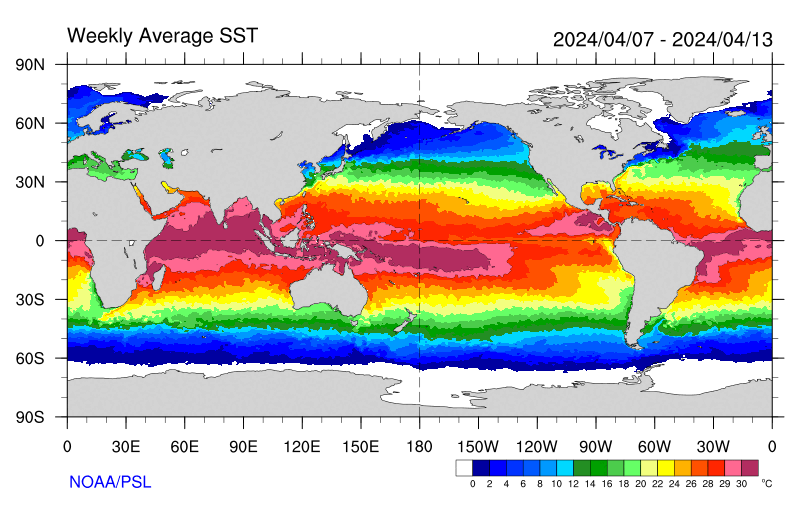
Surface Temperatures. This image uses a color scale
to depict the global pattern of sea surface temperatures (SSTs) (in
degrees Celsius) averaged over a recent 7-day period and based on
measurements by infrared sensors onboard Earth-orbiting satellites.
(Depending on your browser, you may have to place your mouse cursor on
the slide bar to the right and scroll down to view the entire image.)
Compare SSTs in the Northern Hemisphere with those in the Southern
Hemisphere. Return to the RealTime Ocean Portal.
Under Geological, click on Current
Earthquake Activity. The USGS Current World
Seismicity page provides a global map of the locations of seismic
(earthquake) events color-coded for the past seven days. The size of
the squares represents the magnitude of recent earthquakes. Note how
earthquakes are concentrated along the margin of the Pacific Ocean.
Details of recent earthquakes can be found by clicking on their map
squares. Return to the RealTime Ocean Portal.
The ocean is home to a wide variety of habitats and organisms.
Under Biological, click on Ocean
"Color" (Productivity). This is
a satellite-derived (SeaWiFS) color-coded map of biological
productivity in the surface waters of the world ocean is averaged from
October 1978 to date. Orange and red indicates the highest
productivity, while dark blue and violet indicate the lowest
productivity. Note the vast areas of relatively low productivity over
the central regions of the subtropical ocean basins. Individual months
within this period may be chosen for viewing. Now return to the RealTime Ocean Portal.
Under Atmosphere/Ocean Interaction, click
on TRMM/GPM
Tropical Rainfall. The TRMM/GPM (Tropical
Rainfall Measuring Mission) page includes color-coded maps of
the Monthly Mean Rainrate (in mm per day) across the tropics for the
last 30 days ending on the present date. Changes in rainfall are linked
to large-scale shifts in the atmosphere/ocean circulation in the
tropics. Now return to the RealTime Ocean Portal.
Take a few minutes when you have time to browse the other data
and information sources available via the RealTime Ocean Portal. Return frequently to learn more about the many resources on
the ocean in the Earth system. Bon voyage!
Historical Events
- 28-30 August 1839...A hurricane moved from Cape Hatteras,
NC to offshore New England. An unusual feature of the hurricane was the
snow it helped produce, which whitened the Catskill Mountains of New
York State. Considerable snow was also reported at Salem, NY. (The
Weather Channel)
- 28 August 1937...A devastating cyclone hit Hong Kong, killing 11,000. (National Weather Service files)
- 28 August 1965...CDR Scott Carpenter, USN, and nine
aquanauts entered SeaLab II, 205 ft. below Southern California's waters
to conduct underwater living and working tests. (Naval Historical
Center)
- 28 August 1988...Tropical Storm Chris spawned a tornado
near Manning, SC, which killed one person, and spawned three tornadoes
in North Carolina. Chris produced one to two-foot tides, and three to
six-inch rains, over coastal South Carolina. (The National Weather
Summary) (Storm Data)
- 28 August 2005...Hurricane Katrina attained category 5 status (on the Saffir-Simpson Scale) on the morning of the 28th and reached its peak strength at 1 PM CDT that day, with maximum sustained winds of 175 mph and a minimum central pressure of 902 millibars (or 26.6 inches of mercury). (National Weather Service files)
- 28 August 2011...After striking eastern North Carolina on the 27th as a category 1 hurricane (on the Saffir-Simpson Scale), Hurricane Irene weakened to a tropical storm as it moved into New York State and New England. Widespread flooding occurred from New Jersey through New York to Vermont, with 14 river flooding records broken in the Empire State alone. Ten thousand flights were canceled and several interstates were closed. Forty people lost their lives. (National Weather Service files)
- 29 August 1583...The Delight was
wrecked on Sable Island, Nova Scotia during a heavy gale, blinding rain
and thick fog. This was Canada's first recorded marine disaster, taking
85 lives. (The Weather Doctor)
- 29 August 1979...Winds associated with Hurricane David
reached 145 mph as the hurricane crossed the island of Dominica. The
capital city, Roseau, was devastated, with 56 fatalities and 60,000 out
of a population of 80,000 left homeless. About three-quarters of the
coconut and banana crops were destroyed. (Accord's Weather Guide
Calendar)
- 29 August 1988...The remnants of Tropical Storm Chris
drenched eastern Pennsylvania with up to five and a half inches of
rain, and produced high winds that gusted to 90 mph, severely damaging
a hundred boats in Anne Arundel County, MD. (The National Weather
Summary) (Storm Data)
- 29 August 1994...Hurricane John, also known as Typhoon John, lasted 30 days as it affected both the northeast and northwest Pacific basins making it the longest lasting tropical cyclone. It formed in the northeast Pacific, reached hurricane force there, moved across the Dateline and was renamed Typhoon John, and then finally recurved back across the dateline and renamed Hurricane John again. (National Weather Service files)
- 29 August 2005...Hurricane Katrina, the costliest and one
of the five deadliest hurricanes in US history, made landfall along the
Louisiana Gulf Coast southeast of New Orleans as a category 3 on the
Saffir-Simpson Scale after reaching category 5 status earlier. Massive
destruction was reported in coastal Mississippi and in New Orleans. As
many as 1833 people reportedly died from Katrina in the US. (National
Hurricane Center)
- 30 August 1913...The US Navy tested the Sperry gyroscopic
stabilizer (automatic pilot). (Naval Historical Center)
- 30 August 1942...A hurricane weakened in moving 160 miles
across south Texas from landfall at Matagorda to San Antonio, winds
still gusting from 50 to 70 mph at San Antonio for more than five
hours. Seventy of 75 planes were damaged at the city airport. Many
trees were destroyed, but the famed Alamo's walls withstood the storm.
(Accord's Weather Guide Calendar)
- 31 August 1842...The U.S. Naval Observatory was authorized
by an act of Congress. (Today in Science History)
- 31 August 1954...Hurricane Carol swept across eastern New England killing 60 persons and causing $450 million damage. It was the first of three hurricanes to affect New England that year. (National Weather Service files)
- 31 August 1979...Category 5 Hurricane David destroyed 70% of the Dominican Republic and took the lives of 2,000 of her citizens. The storm would go on to strike the U.S. and produce torrential rains up the entire length of the East Coast. (National Weather Service files)
- 1 September 1858...The first transatlantic cable failed
after less than one month of service. (Today in Science History)
- 1-2 September 1935...Perhaps the most intense hurricane
ever to hit the U.S. struck the Florida Keys with sustained winds of
over 155 mph with gusts exceeding 200 mph. On the 1st,
the "Labor Day Hurricane" formed rapidly over the Bahama Islands and
intensified into a Category 5 hurricane (on the Saffir Simpson Scale)
with sustained winds of over 155 mph and gusts exceeding 200 mph. On
the next day, this hurricane generated a 15-foot tide and waves 30-ft
high, as it became the first known Category 5 hurricane to hit the U.S.
Mainland. More than 400 persons perished in the storm on that Labor
Day, including many World War I veterans building a bridge from the
Keys to the mainland. The barometric pressure at Matecumbe Bay, FL hit
a record low for the U.S. at 26.35 inches of mercury (or 892
millibars). (David Ludlum) (The Weather Doctor)
- 1 September 1974...Navy Lieutenant Judy Neuffer became the
first woman to pilot a plane through the eye of a hurricane. (Northern
Indiana NWSFO)
- 1 September 1985...A joint French-American expedition
headed by the American explorer, Robert D. Ballard, located the wreck
of the sunken liner RMS Titanic on the floor of the
North Atlantic using an experimental and unmanned submersible craft Argo.
The wreckage of the Titanic, which sank in April 1912 on its maiden
voyage after colliding with an iceberg, was found at a depth of about
13,000 feet and approximately 400 miles west of Newfoundland. (The
History Channel)
- 1 September 2002...Typhoon Rusa was the most powerful typhoon to hit South Korea in over 40 years as 132 people were reported dead or missing. Winds gusted up to 127 mph and up to 36 inches of rain fell in eastern and southern South Korea. (National Weather Service files)
- 2 September 1752...The British Empire adopted the Gregorian
Calendar, nearly two centuries later than most of western Europe
(primarily 1582). To correct the imprecise leap year correction in the
Julian Calendar, 11 days were dropped making the following day 14
September. (Wikipedia) (Today in Science History)
- 2 September 1775...The 1775 Newfoundland hurricane, also known as the "Independence Hurricane", was a hurricane that hit the Colony of Newfoundland in September 1775. It is believed to have killed at least 4,000 people, making it one of the deadliest Atlantic hurricanes of all time. The death toll in Virginia and North Carolina was 163 lives. (National Weather Service files)
- 2 September 1935...The 1935 Labor Day Hurricane, one of the most intense hurricanes to ever hit the U.S., struck the Florida Keys, packing 200-mph winds and killing between 408 to 600 people. The hurricane produced a 15-foot tide and storm surge waves 30 feet high. The barometric pressure at Matecumbe Bay, FL hit a United States record low of 26.35 inches of mercury (892.4 mb). (National Weather Service files)
- 3 September 1821...A hurricane made landfall at Long
Island, near the current J.F. Kennedy Airport and then moved through
western Connecticut. The hurricane produced a record high tide at New
York City. (David Ludlum)
- 3 September 1930...A Category 4 hurricane (on the Saffir-Simpson Scale) devastated Dominican Republic on this day. This hurricane killed more than 8,000 individuals, which is it the fifth deadliest Atlantic hurricane on record. (National Weather Service files)
Return to RealTime Ocean Portal
Prepared by DS Ocean Central Staff and Edward J. Hopkins,
Ph.D.,
email hopkins@aos.wisc.edu
© Copyright, 2017, The American Meteorological Society.