WEEKLY CLIMATE NEWS
DataStreme ECS Week Twelve: 1-5
December 2014
ITEMS
OF INTEREST
- Beginning of meteorological winter season -- The winter meteorological season
in the Northern Hemisphere starts on Monday (1 December). Recall that
climatologists and meteorologists have elected to use a standard three-month grouping to
identify each meteorological season. Hence,
the months of December, January and February are considered the winter meteorological season. You
will note that the winter solstice, marking the day where the length of
daylight is least in the Northern Hemisphere is still three weeks away,
falling on Sunday, 21 December 2014. Since the lowest temperatures
typically fall in mid to late January, the meteorological winter tends
to be centered on the coldest time of the year in the Northern
Hemisphere.
In addition, this past Sunday marked the end of the official 2014
hurricane seasons in the North Atlantic, which includes the Gulf of
Mexico and the Caribbean, along with the eastern and central North
Pacific basins.
- The 2014 hurricane seasons reviewed -- With the end of the official 2014 hurricane season in
both the North Atlantic and North Pacific on Sunday (30 November 2014),
a quick review of this year's tropical cyclone statistics for the
official 2014 hurricane season has been made for both basins. [AMS
DataStreme Atmosphere] Additional information is available from NOAA News.
For those who are interested in obtaining historic hurricane
information, the "Historical
Hurricanes Mapping & Analysis Tool" developed by NOAA
allows the search and display of detailed data for more than 6000
tropical cyclones in seven of the planet's major ocean basins based
upon a data set that runs from 1842 to 2013. Coastal population trends
are also available for the Atlantic and Gulf Coasts of the United
States.
- Tropical cyclone climatologies of North Atlantic
and the eastern North Pacific -- The National Hurricane
Center (NHC) has an updated and revised edition of its "Tropical
Cyclones of the North Atlantic Ocean, 1851-2006." While a paper copy of
this book is available for a cost from NHC, a 243-pg pdf file of this edition can be downloaded for free. NHC also released the first edition of
"Tropical Cyclones of the Eastern North Pacific Ocean, 1949-2006." In
addition to a paper copy is available for sale, a free 164-page pdf
file is available.
Both of these climatologies have numerous graphics that show long-term
changes in tropical cyclone frequency in the two basins.
A climatology of tropical cyclones in the central North Pacific from
the 1950s to 2008 is available from the CPHC
climatology website maintained by the Central Pacific
Hurricane Center (CPHC) in Honolulu, HI.
- High-quality maps of December temperature and precipitation normals across US available -- The PRISM Climate Group at Oregon State University's website has prepared high-resolution maps depicting the normal maximum, minimum and precipitation totals for December and other months across the 48 coterminous United States for the current 1981-2010 climate normals interval. These maps, with a 800-meter resolution, were produced using the PRISM (Parameter-elevation Regressions on Independent Slopes Model) climate mapping system.
- December weather calendar for a city near you -- The Midwestern Regional Climate Center maintains an interactive website that permits the public to produce a ready to print weather calendar for any given month of the year, such as December, at any of approximately 270 weather stations around the nation. (These stations are NOAA's ThreadEx stations.) The entries for each day of the month includes: Normal maximum temperature, normal minimum temperature, normal daily heating and cooling degree days, normal daily precipitation, record maximum temperature, record minimum temperature, and record daily precipitation; the current normals for 1981-2010.
- It's Sure Dark! -- Have you noticed
that the sun is setting early these days? During the first ten days of
December, many locations throughout the country will experience their
earliest sunset times of the year. The exact day for the earliest
sunset depends upon the latitude, so you may want to check the date in
your locale from the sunrise tables appearing in an on-line,
interactive service available for the entire
year at most cities in the United States. The reason for the
earliest sunsets occurring in early December rather than on the winter
solstice (during the morning hours of Sunday, 21 December 2014) is
that the sun is not as precise a timekeeper as our watches. Because of
a combination of factors involved with Earth's elliptical orbit about
the sun and the tilt of Earth's spin axis with respect to the plane of
the ecliptic, the sun appears to "run fast" by as much as 15 minutes as
compared with clock time in November. However, with the approach of the
winter solstice and perihelion (the smallest earth-sun distance during
the early morning of 4 January 2015), the apparent sun slows during
December and finally lags the clock by 12 minutes in February.
Consequently, a noticeable and welcome trend toward later sunsets can
be detected by the end of December, especially by those residents in
the northern part of the country. However, the latest sunrises occur at
most locales in early January, meaning that early risers will continue
seeing dark and dreary mornings for another month.
- State, national and global instrumental records
-- Temperature and precipitation data have been collected
around the world since the mid-19th century. Beginning in the 1890s, a
sufficiently dense climate network has been established in the United
States and its territories. The records from around the nation and from
around the global have been collected and archived at several central
locations, such as NOAA's National Climatic Data Center (NCDC).
Scientists at NCDC along with colleagues at NASA's Goddard Institute
for Space Studies and in the United Kingdom have produced time series
of area-average monthly and annual temperatures for over a century on
state, national and global space scales. For more details on these
records and how to access them, please read this week's Supplemental Information...In Greater Depth.
CURRENT
CLIMATE MONITORING
- Satellite tracks movement of large Antarctic iceberg -- An image made within the last two weeks by the MODIS sensor on NASA's Aqua satellite shows the massive iceberg B31 as it drifts toward the west across the Amundsen Sea. This iceberg had separated from Antarctica's Pine Island Glacier one year ago and began drifting across Pine Island Bay. This B31 iceberg is 33 kilometers long and 20 kilometers wide. [NASA Earth Observatory]
- Five new NASA field campaigns to tackle climate issues in 2015 -- NASA is planning on conducting five new airborne field campaigns during 2015 that are designed to investigate several issues that could affect the Earth's climate. These five selected campaigns are part of NASA's Earth Venture-class projects are:
- Melting Greenland glaciers – intended to investigate the role of warmer, saltier Atlantic subsurface waters in Greenland glacier melting, which should help improve estimates of future sea level rise by observing changes in glacier melting where ice contacts seawater.
- Atmospheric chemistry and air pollution – designed to study the impact of human-produced air pollution on certain greenhouse gases.
- Ecosystem changes in a warming ocean – aimed at improving predictions of how ocean ecosystems would change with ocean warming by studying the annual life cycle of phytoplankton and the impact small airborne particles derived from marine organisms have on climate in the North Atlantic.
- Greenhouse gas sources – designed to quantify the sources of regional carbon dioxide, methane and other gases, as well as to document how weather systems transport these gases in the atmosphere.
- African fires and Atlantic clouds – intended to probe how smoke particles from massive biomass burning in Africa influences cloud cover over the Atlantic.
[NASA Jet Propulsion Laboratory]
- First 3-D images of underside of Antarctic sea ice made by robotic underwater vehicle -- Researchers from the United States, Australia and the United Kingdom recently have produced high-resolution, three-dimensional maps of the underside of Antarctic sea ice using data collected by the autonomous underwater vehicle (AUV) called "SeaBED." This vehicle measured and mapped the underside of sea-ice floes in three previously inaccessible areas off the Antarctic Peninsula at depths ranging between 20 and 30 meters. AUVs like the SeaBED are expected to serve as powerful tools for studying future changes in sea-ice extent.[National Science Foundation News]
PALEOCLIMATE
RECONSTRUCTION
- Snowmastodon Fossil Site in Colorado sheds light on climate change in the West -- The Denver Museum of Nature and Science and the Smithsonian Institution have partnered to publish the Snowmastodon Project Science Volume in the international journal Quaternary Research in which 47 researchers from the United States and other countries studied climate change in the American West based upon a wide variety of fauna and flora specimens from the previous interglacial period (130,000 and 110,000 years ago) discovered in sediments at the Ziegler Reservoir near Snowmass Village, CO in 2010. Some of the fossils included bones of mammoths. The Snowmastodon site was an ancient lake that filled with sediment between 140,000 and 55,000 years ago preserving a series of Ice Age fossil ecosystems. [USGS Newsroom]
- Strengthening El Niño events during the Holocene -- A team of researchers from the United States and China running climate models on computers at the National Center for Atmospheric Research has found that El Niño events have intensified during the late Holocene or over the last 6000 years. These climate models examined the large-scale influences such as changes in atmospheric carbon dioxide, ice sheet melting and Earth's orbital changes that could affect the strength of El Niño events over the last 21,000 years. The intensification of the El Niño events appears to be related to increased global temperatures, with the feedbacks between ocean and atmosphere involving surface winds having grown stronger. The computer simulations appear to corroborate observational data obtained from historical sediments off the Central American coast and from change in fossil coral. [University of Wisconsin-Madison News]
CLIMATE
MODELING
- Scientists use equations to model clouds -- A researcher at NASA's Jet Propulsion Laboratory has been writing computer programs that involve a series of mathematical equations used to simulate cloud formation, especially those involving micro-level processes. After running numerical simulations on her model, she compares the computer model output with satellite measurements. In recent scientific paper, she suggests that precipitation, temperature and humidity all contribute to how clouds respond to aerosols, or tiny airborne particles. Other modelers have been attempting to understand the role of clouds in affecting large-scale climate through the use of global-scale climate models. [NASA Global Climate Change News ]
- New global portrait of carbon dioxide provided by a computer model -- Scientists at NASA Goddard Space Flight Center have developed a new visualization of how atmospheric carbon dioxide travels around the globe using an ultra-high resolution NASA computer model called GEOS-5. This model has a much finer spatial resolution than most global climate models, as climate variables such as temperature, pressure and wind speed/direction are determined on a grid with a horizontal dimension of only 7 kilometers. Recently the scientists released a "Nature Run" version of their visualization in which observational data of atmospheric conditions, greenhouse gas emissions and aerosols from natural and human sources were used in the simulation of the natural behavior of the Earth's atmosphere between May 2005 and June 2007. [NASA Global Climate Change News]
CLIMATE
FORECASTS
- Changing climate may not result in energy savings across nation -- According to the Third National Climate Assessment, the interagency report issued in May 2014, people living across the contiguous United States would not likely see a net energy savings from reduced space heating demands due to projected warmer winters because anticipated warmer summers would result in increased air conditioner usage. National maps were generated that show the geographic patterns of the projected changes in average energy demands for cooling as denoted by changes in the accumulated cooling degree day units through mid-century (2021-2050) and for the end of the century (2070-2099) based on the 1971-2000 average. The projected changes are based on a scenario that assumes greenhouse gas emissions continue increasing throughout the 21st century. [NOAA Climate.gov News]
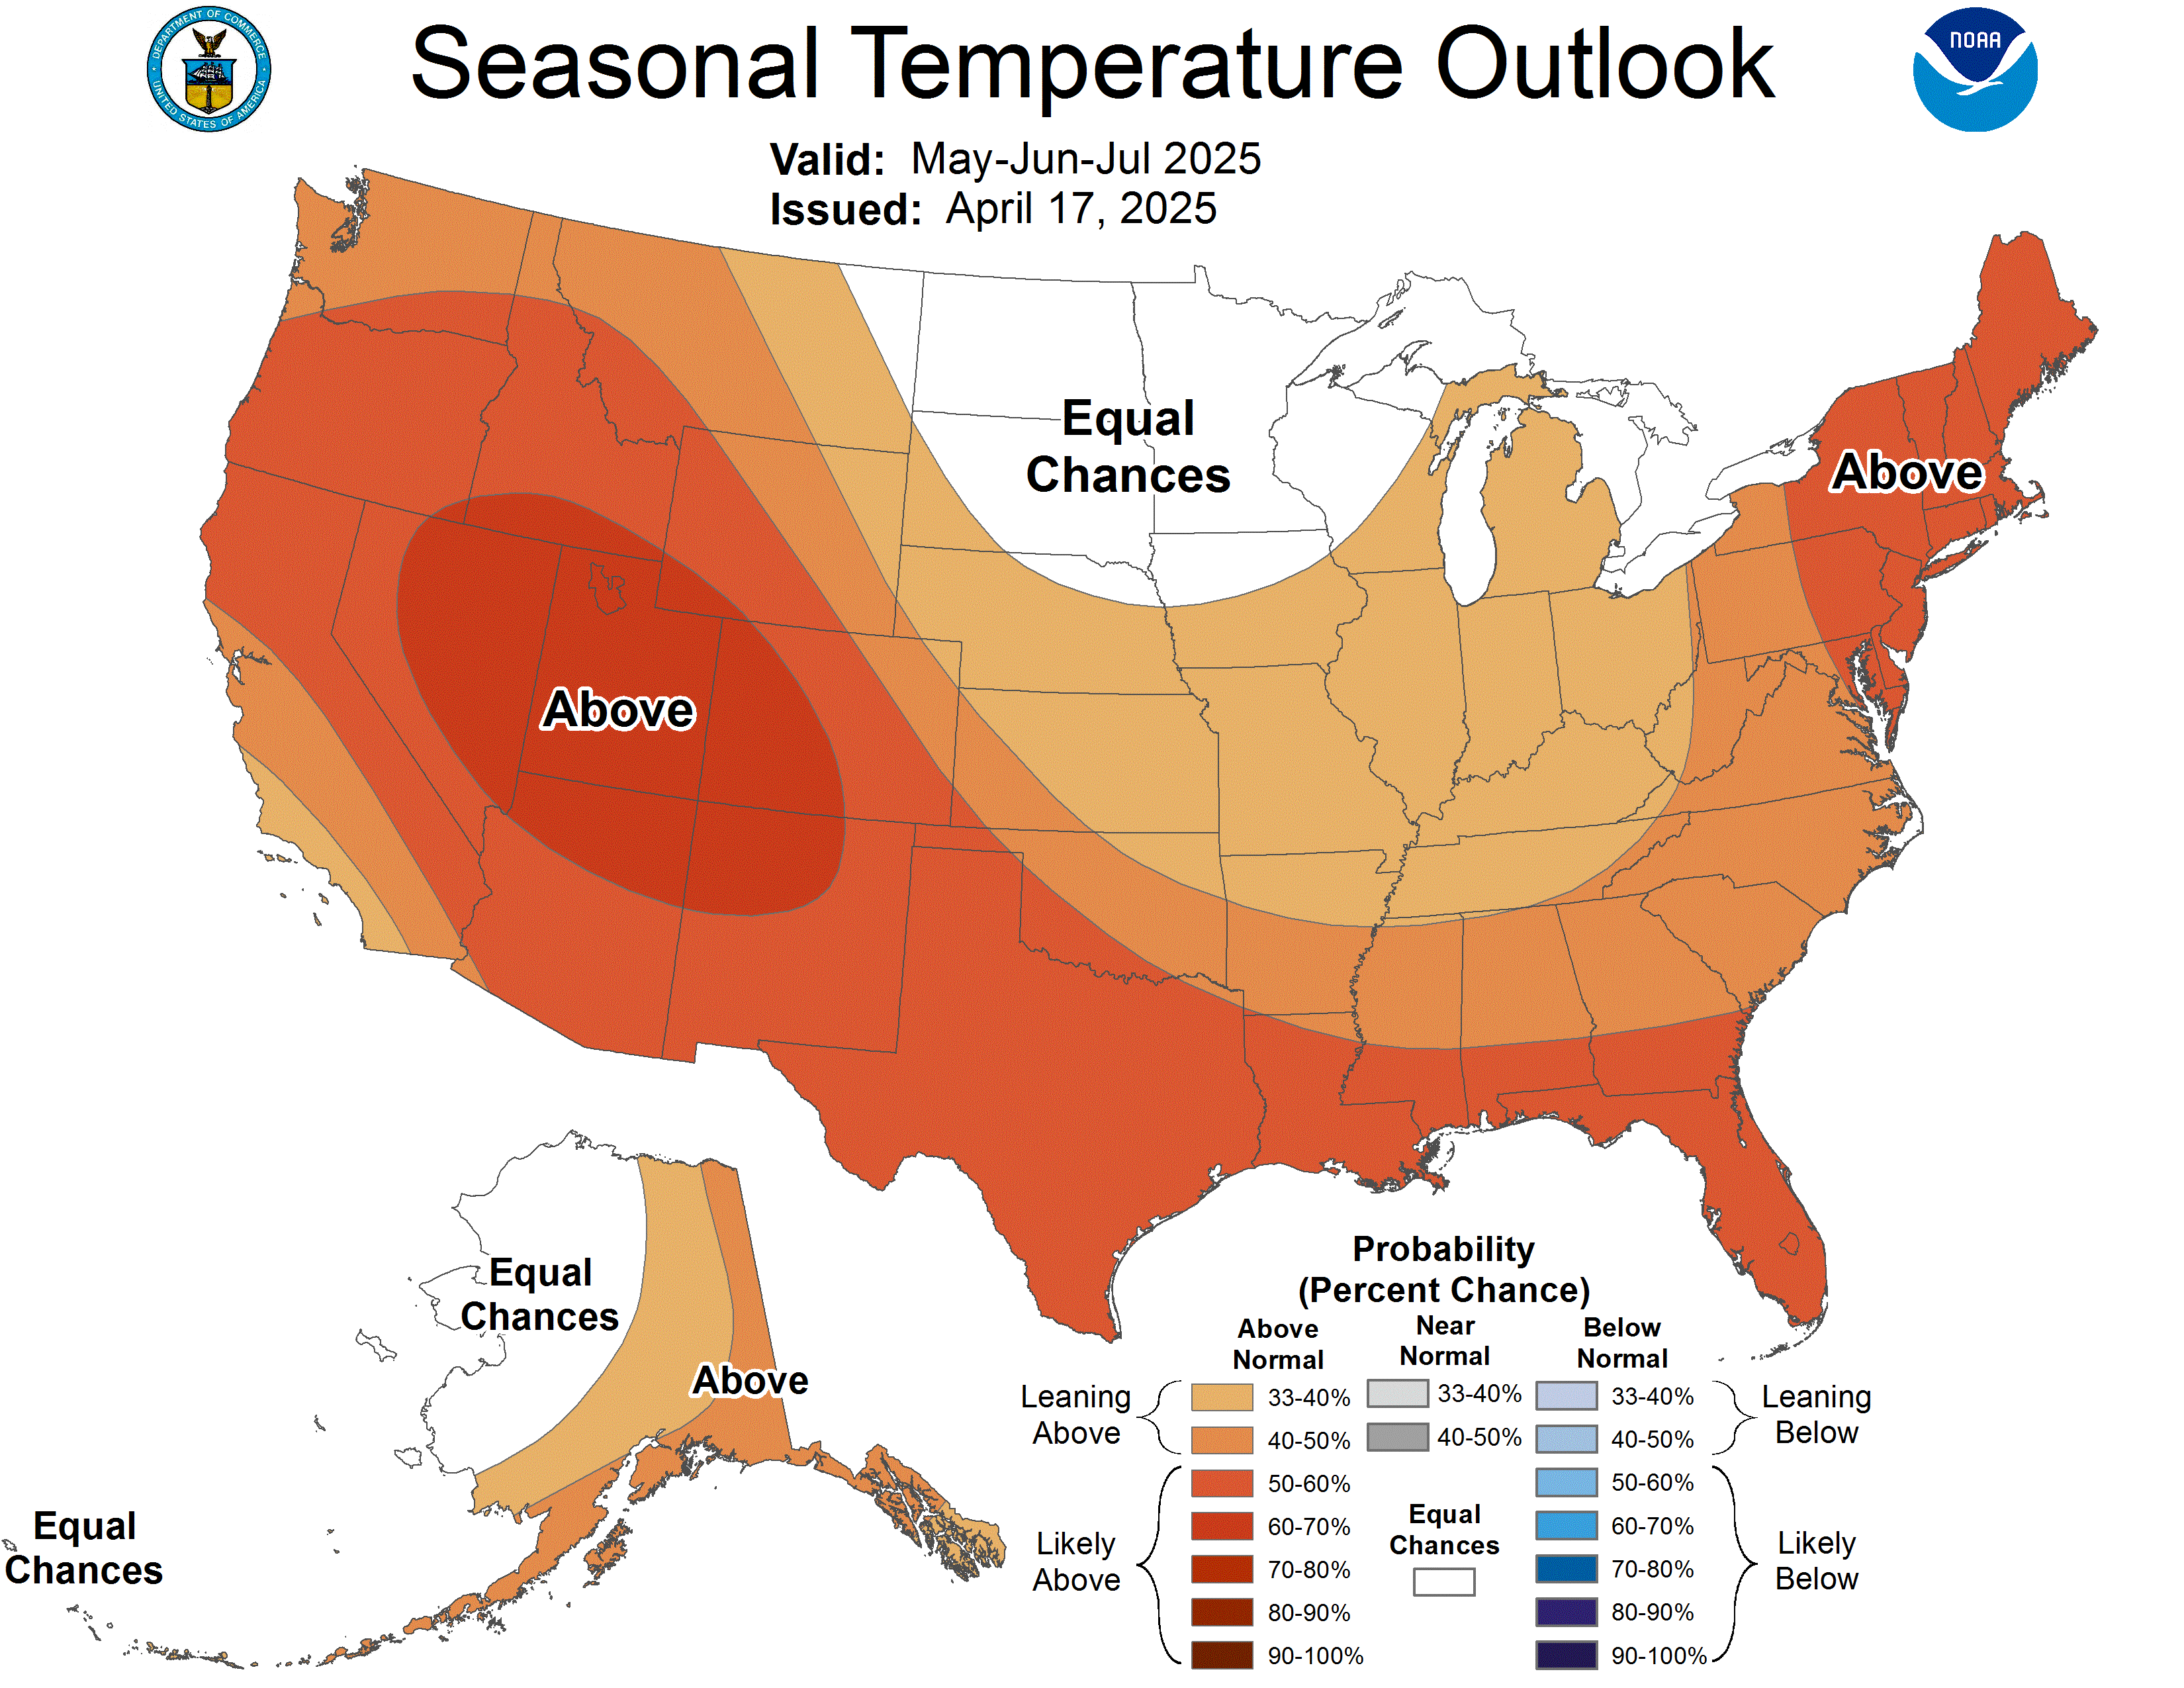
- Canadian national seasonal outlook issued -- Forecasters with Environment Canada issued their outlooks for temperature and precipitation across Canada for December 2014 through February 2015, which represents meteorological winter. The temperature outlook indicates that
western Canada, extending across British Columbia eastward to Manitoba and northward to the Beaufort Sea could experience above normal (1981-2010) temperatures for these three months. In addition, sections of Nova Scotia and Newfoundland could have above average temperatures. However, several scattered areas across Ontario near Lake Superior and northern Canada north of Hudson Bay could have below average winter temperatures. Elsewhere, a large section of eastern Canada should have near normal temperatures for the next three months.
The Canadian precipitation outlook for the 2014-15 winter season indicates that scattered areas of below average precipitation across southern sections of British Columbia, Saskatchewan and Manitoba, along with northern Labrador. Conversely, above normal winter precipitation was projected for a large area extending across the sections of the Yukon, Northwest and Nunavut Territories and sections of Newfoundland.
[Note for comparisons and continuity with the three-month seasonal outlooks of temperature and precipitation generated for the continental United States and Alaska by NOAA's Climate Prediction Center, one would need to use Environment Canada's probabilistic forecasts for temperature and precipitation.]
- Australian tropical cyclone season outlook issued -- Forecasters at the Australian Government's Bureau of Meteorology recently released an outlook for the upcoming 2014-15 Australian tropical cyclone season that typically begins in November and runs through April. These forecasters foresee average to below average tropical cyclone activity in the five regions that surround that continent. Their outlook is based upon the appearance of El Niño-like conditions across the tropical Pacific Ocean and climate models suggest the possibility of a weak El Niño event before the end of 2014. Typically, the waters around Australia experience fewer tropical cyclones during El Niño events and few of these systems make landfall on the continent.
[Australian Bureau of Meteorology]
CLIMATE
AND SOCIETY
- Global warming skeptics remain unmoved by extreme weather events -- A sociology professor at Michigan State University and colleagues have found that occurrences of extreme weather events do not appear to sway the option of global warming skeptics or cynics. The researchers point to a study of a March 2012 Gallup Poll results in which only 35 percent of the responding US citizens believed that global warming was the main cause of the abnormally high temperatures across most of the nation during the 2012 winter. Although the citizens accurately perceived the reality of the warmer winter, the respondents appeared to hold fast to their existing beliefs, with people who identified as Republican tended to doubt the existence of global warming, while Democrats generally believed in it. [Michigan State University News]
- Earthweek -- Diary of the Planet [earthweek.com] Requires Adobe Acrobat Reader.

Concept of the Week: Climate Sensitivity
Climate sensitivity is a relatively new and powerful concept
in climate science. It is a measure of how responsive the temperature
of Earth's climate system is to a change in radiative forcing due to
increases in atmospheric carbon dioxide, an important greenhouse gas,
combined with the contributions of feedbacks within the system.
Specifically, the term is defined as how much the global mean surface
temperature will increase if there is a doubling of atmospheric
greenhouse gases (in terms of equivalent CO2),
once the planet has had a chance to settle into a new equilibrium after
the increase occurs. In other words, it's an assessment of how Earth's
climate will respond to that doubling.
According to NASA climate scientist James Hansen, the concept
of climate sensitivity has its origins in a request made by President
Jimmy Carter in 1979 for the National Academy of Sciences (NAS) to
report on the potential impact on climate of the increasing atmospheric
concentration of carbon dioxide. Jule G. Charney (1917-1981) of the
Massachusetts Institute of Technology (MIT) led the Academy
investigation team. He designed a now classic experiment where computer
models of Earth's climate system had the atmospheric concentration of CO2 doubled while all other variables (except temperature) were held
constant.
The addition of CO2 makes the
atmosphere more opaque for outgoing infrared radiation (heat), warming
the lower atmosphere and cooling the upper atmosphere. Applying basic
radiation laws, Charney found that doubling the atmospheric CO2 concentration would reduce the net radiative flux (from Earth to space)
at the tropopause by a global average of about 4 watts per square meter
(W/m2). How much warmer would Earth's surface
become as a consequence of this enhanced greenhouse effect? According
to the Stefan-Boltzmann law, the radiation emitted by an object is
directly proportional to the fourth power of the object's absolute
temperature. To reestablish radiative equilibrium following a doubling
of atmospheric CO2, Earth must radiate to space
an additional 4 W/m2, brought about by a global
warming of 1.2 Celsius degrees (or 0.3 Celsius degrees per W/m2).
Charney's initial experiment accounted for the effect of a
forcing agent (i.e., atmospheric CO2) on global
climate but not the influence of feedbacks. As noted in the Concept
of the Week for Week 2, forcing agents and mechanisms drive
climate change, while feedbacks determine the magnitude of climate
change. Hence, Charney's "no-feedback" experiment significantly
underestimates the amount of global warming likely to accompany a
doubling of atmospheric CO2. With inclusion of
feedbacks, the 1979 Academy study indicated that global warming could
range from 2 to 3.5 Celsius degrees. The most recent IPCC report (AR4)
estimates the magnitude of warming with feedbacks incorporated as 3
Celsius degrees with a range of uncertainty of 2 to 4.5 Celsius
degrees. This greater sensitivity depends primarily on all the
different feedbacks, both positive and negative, that either amplify or
diminish the greenhouse effect. The three primary feedbacks involve
clouds, sea ice, and water vapor.
In summary, climate sensitivity is usually
expressed in terms of the equilibrium change in global mean annual
surface temperature caused by an increment in downward infrared
radiative flux that would result from sustained doubling of atmospheric
CO2 concentration compared to its pre-industrial
level (taken to be 280 ppmv).
Concept of the Week: Questions
- All other factors being equal, the addition of CO2 to the atmosphere [(increases)
(decreases)(has
no effect upon)] the flux of infrared
radiation from Earth's surface to space.
- Charney's initial estimate of the amount of global warming
that would accompany a doubling of atmospheric CO2 [(did)(did
not)] account for the temperature
change(s) likely to accompany feedbacks in Earth's climate system.
Historical Events:
- 1 December 1831...The coldest December of record in the
northeastern U.S. commenced. Temperatures in New York City averaged 22
degrees, with just four days above freezing, and at Burlington, VT the
temperature never did get above freezing. The Erie Canal was closed the
first day of December, and remained closed the entire month. (David
Ludlum)
- 1 December 1913...A six day Front Range snowstorm began,
ultimately producing 45.7 inches of snow at Denver, CO, the biggest
single snowstorm on record for that city. It produced a record total of
46 inches at Denver, CO. (David Ludlum) (Intellicast)
- 3-10 December 1926...Record rain fell on Yuma, AZ over a
one-week period. On the 4th 1.10 inches of rain
fell, and by the 10th a total of 4.43 inches had
fallen, to set an all-time December monthly record. The mean annual
precipitation for Yuma is only 3.38 inches. (Accord Weather Guide
Calendar)
- 3 December 1982...Big Fork, AR received 14.06 inches of
rain, setting a 24-hour maximum precipitation record for the state.
(NCDC)
- 4 December 1982...The temperature in New York City's
Central Park reached 72 degrees to establish a record high for
December. The month as a whole was also the warmest of record. (The
Weather Channel)
- 5 December 1941...The temperature at Enosburg Falls soared
to 72 degrees to establish a state record for Vermont for the month of
December. (The Weather Channel)
- 6 December 1950...Duluth, MN had their greatest 24-hour
snowfall when 25.4 inches fell. (Intellicast)
Return to DataStreme
ECS website
Prepared by Edward J. Hopkins, Ph.D., email hopkins@meteor.wisc.edu
© Copyright, 2014, The American Meteorological Society.