WEEKLY CLIMATE NEWS
22-26 December 2014
DataStreme Earth's Climate Systems will return for Spring 2015
with new Investigations files starting during Preview Week, Monday, 19
January 2015. All the current online website products, including
updated issues of Weekly Climate News, will
continue to be available throughout the winter break period.
Happy Holidays to you and yours from the AMS DS Earth's
Climate Systems Central Staff!
Ed Hopkins
ITEMS OF
INTEREST
- Holiday lights seen from space -- Scientists at NASA's Goddard Space Flight Center recently released satellite images and a report detailing how holiday lights in various cities around the United States are emitting increased light intensity that is detectable by the Visible Infrared Imaging Radiometer Suite sensor onboard the NASA/NOAA Suomi NPP satellite. The nighttime images clearly indicate brighter and more intense light emanating from several metropolitan areas in the Middle Atlantic States and in southern California beginning by Black Friday (after Thanksgiving) and continuing through New Years Day In addition, several cities in the Middle East had increased illumination during the holy month of Ramadan. [NASA Goddard Space Flight Center ]
- Dreaming of a White Christmas -- NOAA's National Climatic Data Center produced a national map showing the climatological probability (in percent) that a snow depth of at least one inch would be observed on the morning of 25 December based upon the 1981-2010 standard 30-year climatological reference interval. This map shows the ratio of the number of times that a particular station experienced a white Christmas during the interval as a probability. For example, Des Moines, IA had only 12 Christmases between 1981 and 2010 when an inch or more snow cover was observed, so the probability that residents of Iowa's capital city would have a white Christmas is 40%. Some locations across the nation are almost certain to have a white Christmas, generally along the Canadian border surrounding the Great Lakes, such as Marquette, MI (with 93%) and in New England, such as at Caribou, ME (87%). Stations at higher elevations in the Rockies also have a higher probability, such as at Flagstaff, AZ with a 65%. Sites close to the oceans typically have a lower probability, as the oceans tend to be relatively warm at this time of year. Santa typically finds tough sledding on his journey to that half of the country south of latitude 40 degrees that is not mountainous, where chances of a white Christmas fall from 50% to 20% or less. You can monitor the current snow cover across North America using a snow chart that is based upon satellite data.
- Climatology of Southeast NCAA bowl games updated -- The Southeast Regional Climate Center has provided a listing of the weather history for twelve NCAA college bowl games that are to be played within the next two weeks across the Southeastern States. This climatology includes the warmest, coldest, wettest and snowiest days in the particular bowl's history.
- Student scholarships announced -- The NOAA Office of Education recently announced that scholarships are available to undergraduate and graduate students who are majoring in the atmospheric and oceanic sciences, along with several of the other scientific and technical disciplines that support NOAA's mission and programs. [NOAA Office of Education] These scholarships include:
- Educational Partnership Program (EPP) Undergraduate Scholarship: http://www.epp.noaa.gov/ssp_undergrad_page.html. This program provides an opportunity for rising junior students to study disciplines relating to the NOAA's mission. Students attending Minority Serving Institutions are encouraged to apply. The application deadline for the 2015 EPP Undergraduate Scholarship Program is 31 January 2015.
- Ernest F. Hollings Undergraduate Scholarship Program: http://www.oesd.noaa.gov/scholarships/hollings.html#page=timeline. This program is designed to: (1). increase undergraduate training in oceanic and atmospheric science, research, technology, and education and foster multidisciplinary training opportunities; (2) increase public understanding and support for stewardship of the ocean and atmosphere and improve environmental literacy; (3.) recruit and prepare students for public service careers with NOAA and other natural resource and science agencies at the federal, state and local levels of government; and (4.) recruit and prepare students for careers as teachers and educators in oceanic and atmospheric science and to improve scientific and environmental education in the United States. The application deadline for the 2015 Ernest F. Hollings Undergraduate Scholarship Program is 30 January 2015.
CURRENT
CLIMATE STATUS
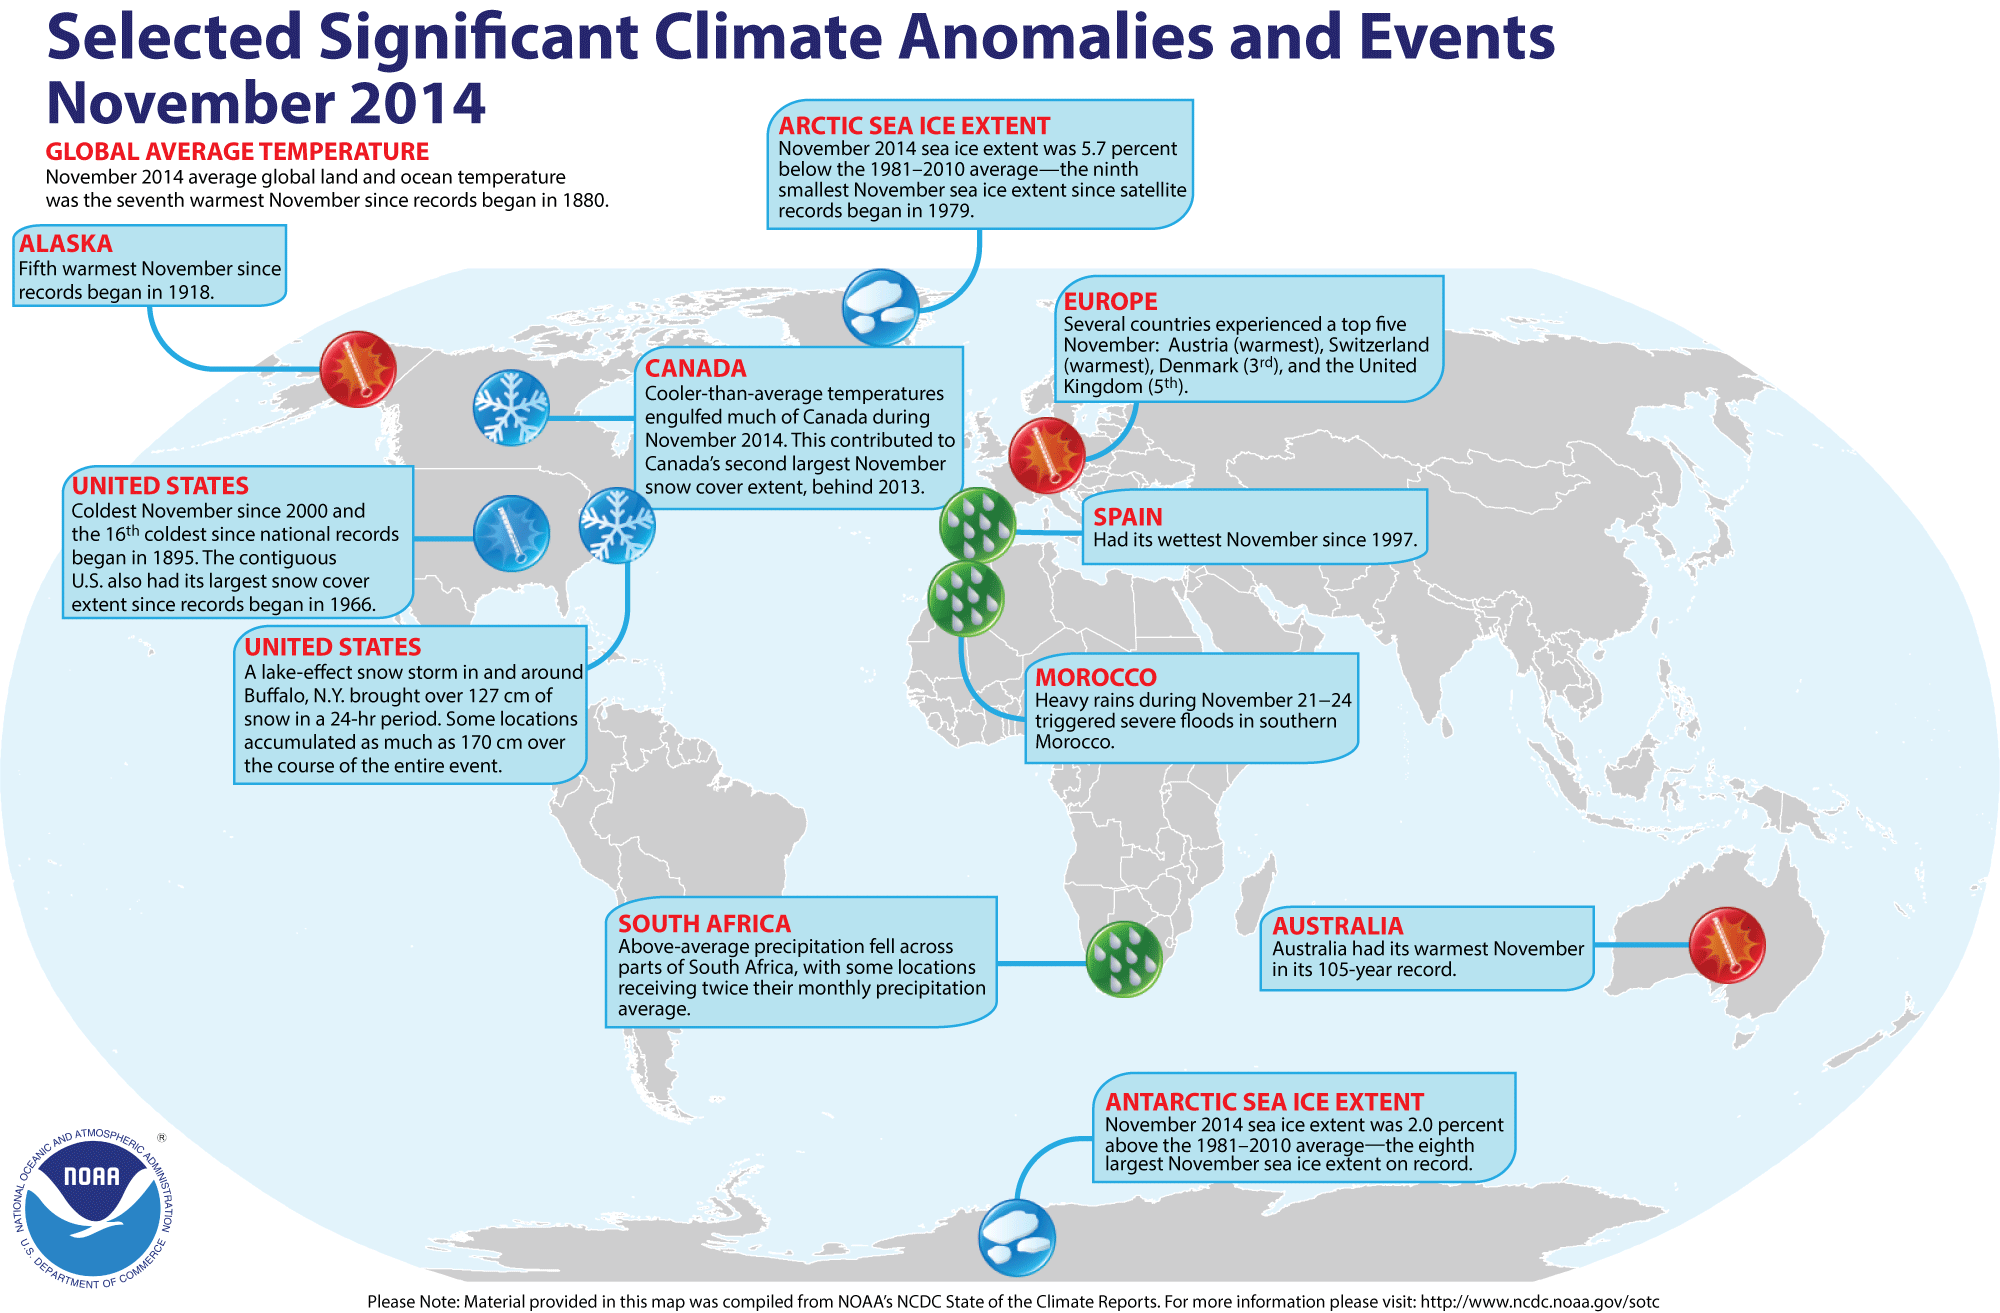
- A global review of November 2014 temperatures -- Preliminary
analysis of temperature data by scientists at NOAA's National Climatic
Data Center indicates that the worldwide combined ocean and land
surface temperature for November 2014 tied the temperature for November 2008 for the seventh highest
global November surface temperature since a sufficiently dense and
reliable network began in 1880. This combined global temperature was approximately 1.2 Fahrenheit degrees above the 20th century (1901-2000) average November temperature. They also found that the global land surface temperatures was the thirteenth highest temperature reading for any November on record, while the global
ocean surface temperature was the highest since 1880. Furthermore, they
reported that the combined land and ocean surface temperature for the
globe during the Northern Hemisphere autumn (September-November 2014)
was the highest for all boreal autumn seasons on record. The global ocean temperature for these three months was also a record high value for the 135-year period of record, while the corresponding global land temperature was the ninth highest on record. The record warm ocean waters in the tropics suggests the possibility of a weak El Niño event developing during Northern Hemisphere winter (December through February). [NOAA/NCDC
State of the Climate]
A global map of Selected Significant Climate Anomalies and Events for November 2014 is available from NCDC.
According to satellite data collected by National Snow and Ice Data Center, the sea ice over the Arctic Ocean during November 2014 had the ninth smallest areal extent for any November since satellite-derived ice records began in 1979. However, the sea ice around Antarctica was the eighth largest November ice extent on record. The Northern Hemisphere snow cover extent was the fifth largest November snow cover in the 49-year period of record that began in 1966. [NOAA/NCDC Global Snow & Ice]
- ...
- ...
- Annual Arctic Report Card released -- Last
week, NOAA's Climate Program Office released its 2014 annual update of
the "Arctic Report Card," a peer-reviewed report of the state of the
air, ocean and ice in the Arctic basin prepared by an international
team of 63 scientists from 13 countries, including those from NOAA.
These experts have found air and water temperatures across the Arctic continued to increase, with Arctic air temperatures increasing at rates more than double the rate of global air temperature increase. Furthermore, the reflectivity of the surface of the Greenland ice sheet was reduced along with shrinkages in the spring snow cover on land and summer ice on the oceans. The general health and numbers of polar bear populations were also observed to decline. [NOAA
News]
Data collected from sensors onboard NASA satellites show a marked increase in the solar radiation absorbed across the Arctic basin since 2000. Measurements made by NASA’s Clouds and the Earth’s Radiant Energy System (CERES) instruments show the rate of absorbed solar radiation in the Arctic in June, July and August has increased by five percent. [NASA Earth Observatory] The decline in the regional surface reflectivity or albedo is due in part to large expanses of open water in summer, which would enhance warming of the region. Maps of trends of absorbed radiation and sea ice fractions between 2000 and 2014 are provided. [NASA Earth Observatory]
CURRENT
CLIMATE MONITORING
- Maps of atmospheric carbon dioxide concentrations obtained from new satellite -- Some of the first global maps of the geographic distribution of atmospheric carbon dioxide obtained over a nearly six-week interval from early October through mid November 2014 from NASA's new Orbiting Carbon Observatory-2 (OCO-2) spacecraft. This OCO-2 spacecraft was launched into a sun-synchronous orbit around the Earth in early July 2014 by NASA to study the carbon dioxide concentrations in the atmosphere, including the "sources" and "sinks" of this greenhouse gas. Another map from OCO-2 shows solar-induced fluorescence, a plant process that occurs during photosynthesis, collected from August through October 2014, during spring (autumn) in the Southern (Northern) Hemisphere. [NASA Jet Propulsion Laboratory]
- Seeing Earth from the Terra satellite for 15 years -- Fifteen years ago last week NASA launched its Terra spacecraft, a polar orbiting satellite that would be part of the agency's Earth Observing System. A collage has been produced of 15 impressive satellite images obtained from NASA's fleet of satellites that include Terra, Aqua and Aura. [NASA Goddard Space Flight Center]
- New spacecraft designed to monitor space weather is readied for launch -- Scientists and engineers are readying NOAA's Deep Space Climate Observatory (DSCOVR) spacecraft for a scheduled launch in late January 2015. DSCOVR, which is designed to be placed in the L1 (Lagrange point) orbit approximately one million miles from Earth (between the Earth and Sun), will have instruments that will make more reliable measurements of solar wind speed designed to ensure high accuracy space weather warnings at NOAA's Space Weather Prediction Center (SWPC). The DSCOVR mission represents a partnership between NOAA, NASA and the US Air Force. [NOAA News]
CLIMATE AND HUMAN HEALTH
- Hot weather means bad news for business -- A study conducted by the National Bureau of Economic Research reports that days that averaged approximately 77 degrees (Fahrenheit) reduced the income of Americans by approximately $5 per day when compared with those days with temperatures that were approximately 20 Fahrenheit degrees lower. Furthermore, a county's average economic productivity decreases by nearly one percent for every Fahrenheit degree that the average daily temperature is above 59 degrees. This study compared temperatures with economics over a 40-year span. The authors of this study warn that if temperatures continue to rise based upon current projections of greenhouse gas emissions, the US economy will lose tens of billions of dollars each year later this century. [Inc.com News]
CLIMATE
FORECASTS
- Seasonal weather outlook released -- Late last week,
forecasters at the NOAA Climate Prediction Center released their new national Seasonal
Outlook for the first three months of 2015 (January-March) that includes the last two months of meteorological winter and the first month of meteorological spring. Specific details of their outlooks include:
- Temperature and precipitation outlooks -- According to their temperature outlook, a large section of the Southern States should experience a high chance of below average temperatures for these three upcoming months. The greatest probability of such an occurrence would be found extending eastward from west Texas along the Gulf Coast to the Atlantic coast of the Carolinas. On the other hand, the western third of the nation was considered to have a better than average chance of above average late winter-early spring temperatures, with the greatest probability of occurrence expected to be in Washington and Oregon. Northern New England would also have a good chance of having above average temperatures for the first three months of the new year. The outlook indicates that the remainder of the nation, primarily across the northern and central Plains, the Great Lakes region and sections of the Middle Atlantic would have nearly equal chances of warmer or cooler than normal conditions.
Their precipitation outlook calls for sections of the Southwest and the Southeast to have a better than even chance of above average precipitation for the first three months of 2015.
The regions that would have the largest chances in the Southwest extend from coastal sections of California across Arizona and New Mexico to Texas and Oklahoma, while sections of Georgia and Florida in the Southeast could also have above average precipitation. Conversely, the interior Northwest was considered to have a better than even chance of below average precipitation running from January through March. Likewise, sections of the Midwest, primarily in Michigan and Indiana appear to have a good chance for below average precipitation. Elsewhere, a large area of the coterminous states should have essentially equal chances of below and above average precipitation for the end of winter and the start of spring.
A summary of the prognostic discussion of the 3-month outlook for non-technical users is available from CPC. These forecasts were based in part that assuming that the current conditions appear to suggest a developing, but weak, El Niño event during the Northern Hemisphere's meteorological winter (December-February), although ENSO-neutral conditions (ENSO = El Niño/Southern Oscillation) continue to linger, where neither El Niño nor La Niña conditions prevail.
A description is also provided as how to read these 3-class, 3-month Outlook maps.
- Seasonal Drought Outlook -- The
forecasters at NOAA's Climate Prediction Center also released their US
Seasonal Drought Outlook last week that would run from late-December 2014 through March 2015. Their outlook would call for persistence of extensive drought conditions across a large section of the West, extending from the southern Plains westward across the southern Rockies and the Great Basin, as well as northward into the interior Northwest. California along some scattered areas across the Southwest could see some improvement in drought conditions, while some of these areas in the Southwest along with Texas and the central Gulf Coast possibly could be removed from drought status. Note: a Seasonal Drought Outlook Discussion is included describing the forecasters' confidence.
- UK Met Office global average temperature forecast made for 2015 -- Last week, scientists at the United Kingdom's Meteorological Office (Met Office) released their annual global temperature forecast for the upcoming year of 2015. They anticipate the global average temperature in 2015 to be 0.64 Celsius degrees above the long-term (1961-1990) average of 14.0 degrees Celsius, with a range of uncertainty extending from 0.52 to 0.76 Celsius degrees around the central estimate. Therefore, 2015 could be one of the warmest years since comprehensive global climate records began in 1880. Using observational data running through October 2014, the scientists also noted that this current year's global temperature has a central estimate of 0.57 Celsius degrees above the 1961-1990 average. These preliminary statistics for 2014 essentially is the same as the forecast made by the Met Office in December 2013. Furthermore, the temperature for the first ten months of the year suggests that 2014 would rank as one of the warmest years dating back to 1880. [Editor's note: The statistics involved with the global temperature record are from the three main global temperature datasets compiled by: The Met Office and University of East Anglia (HadCRUT4); NOAA National Climatic Data Center (NOAA NCDC) and NASA Goddard Institute of Space Studies (NASA GISS). The Met Office uses the 1961-1990 interval for long-term averages that is accepted by the World Meteorological Organization (WMO), rather than the 1981-2010 interval currently used by NCDC. EJH [UK Met Office News]
- "Tipping points" for flooding due to sea-level rise are established -- A team of NOAA scientists recently published a paper entitled "From the Extreme to the Mean: Acceleration and Tipping Points for Coastal Inundation due to Sea Level Rise" that establishes "tipping points" for flooding of the nation's coastal areas due to projected sea-level rise. According to this report, most of US coast may experience these "tipping points" of 30 or more days per year of floods that would be as much as two feet above high tides by 2050. [NOAA News]
CLIMATE
AND SOCIETY
- Earthweek -- Diary of the Planet [earthweek.com] Requires Adobe Acrobat Reader.

Historical Events:
- 23 December 1955...The barometric pressure dipped to 28.97
inches (981 millibars) at Boise, ID, an all-time record for that
location. (The Weather Channel)
- 23 December 1983...The temperature plunged to 50 degrees
below zero at Williston, ND to equal their all-time record.
Minneapolis, MN reported an afternoon high of 17 degrees below zero,
and that evening strong northerly winds produced wind chill readings of
100 degrees below zero in North Dakota. (The National Weather Summary)
- 24 December 1872...Extreme cold gripped the Upper Midwest
on Christmas Eve. Downtown Chicago reported an all-time record low of
23 degrees below zero, which stood until January 1982, and Minneapolis,
MN reached 38 degrees below zero. The afternoon high at Minneapolis was
17 degrees below zero. (David Ludlum)
- 24 December 1963...Memphis, TN set its all-time record low
temperature with 13 degrees below zero, two days after a heavy
14.3-inch snowstorm. (Intellicast)
- 24 December 1982...The "Blizzard of 1982" hit eastern
Colorado. Denver recorded 23.6 inches of snow in 24 hours, setting a
new 24-hour record. Winds of 60 mph whipped the snow into 4 to 8 foot
drifts. Stapleton Airport was closed for 33 hours and most roads were
impassable. (Intellicast)
- 24 December 1983...The barometric pressure reached 31.42
inches at Miles City, MT to establish a high barometric pressure record
for the U.S. It was the coldest Christmas Eve of modern record. More
than 125 cities reported record low temperatures for the date, and
all-time record lows for December were reported at seventeen cities,
including Chicago with a low of 25 degrees below zero, and Havre, MT
with a reading of 50 below zero. Sioux Falls, SD stayed below zero for
eight consecutive days. Great Falls, MT dropped to a frigid 42 degrees
below zero. Dayton, OH reached 13 degrees below zero. (The National
Weather Summary) (Storm Data) (Intellicast)
- 24 December 1989... Christmas Eve 1989 became one of the
coldest on record. Fifty-seven cities in the south central and eastern
U.S. reported record low temperatures for the date, including Elkins,
WV with a reading of 22 degrees below zero. Key West, FL equaled their
record for December with a morning low of 44 degrees. Huntsville, AL
hit one degree above zero. The high of just 45 degrees at Miami, FL was
an all-time record for that location after a morning low of 33 degrees.
It smashed their previous record for the date by twenty degrees. (The
National Weather Summary) (Storm Data)
- 25 December 1988...A massive winter storm made for a very
white Christmas in the western U.S. Las Vegas, NV reported snow on the
ground for the first time of record. Periods of snow over a five-day
period left several feet of new snow on the ground of ski areas in
Colorado, with 68 inches reported at Wolf Creek Pass. (Storm Data) (The
National Weather Summary)
- 25 December 1989...It was a record cold Christmas Day for
parts of the southeastern U.S. Morning lows of zero degrees at
Wilmington, NC and five degrees below zero at Jacksonville, NC
established all-time records for those two locations. Miami Beach, FL
equaled a December record established the previous morning with a low
of 33 degrees. Erie, PA set an all-time snowfall record for the month
as light snow brought the total to 60.3 inches. Tallahassee, FL had a
trace of snow, the first ever for Christmas Day. (The National Weather
Summary) (Storm Data) (Intellicast)
- 26 December 1909...Philadelphia, PA had its record snow to
that date with 21 inches. The Delaware state record was also broken
with 24 inches. (Intellicast)
- 26 December 1947...New York City recorded its all-time
record snow with 25.8 inches at the Battery and 26.8 inches at Central
Park. A record 26.4 inches of snow fell in 24 hours, with as much as 32
inches reported in the suburbs. White Plains had 6 inches in one hour
with 19 inches in just 6 hours. The heavy snow brought traffic to a
standstill, and snow removal cost eight million dollars. Thirty
thousand persons were called upon to remove the 100 million tons of
snow. The storm claimed 27 lives. (26th-27th)
(David Ludlum) (Intellicast)
- 26 December 1983...Miami, FL established a December record
with a morning low of 33 degrees. Just three days earlier, and again
three days later, record high temperatures were reported in Florida,
with daytime highs in the 80s. (The National Weather Summary)
- 26 December 1993...Bitterly cold air prevailed across the
north central states. Sault Ste Marie, MI plunged to 31 degrees below
zero to set a new December record. Tower, MN reached a frigid 50
degrees below zero. (Intellicast)
- 26 December 2004...A massive earthquake measuring 9.0 on
the Richter magnitude scale approximately 100 miles off the western
coast of Sumatra created a tsunami that caused devastation in Sri
Lanka, India, Indonesia, Thailand, Malaysia, The Maldives and many
other areas around the rim of the Indian Ocean. The death toll is
currently estimated at more than 300,000. Officials say the true toll
may never be known, due to rapid burials. Indonesia was worst affected
with as many as 219,000 people killed. (Wikipedia)
- 28 December 1897...The temperature at Dayville, OR hit 81
degrees to establish a state record for December. (The Weather Channel)
- 28 December 1955...Anchorage, AK was buried under 17.7
inches of snow in 24 hours, a record for that location. (28th-29th)
(The Weather Channel)
- 28 December 1958...Albuquerque, NM received 14.2 inches of
snow to establish a 24-hour record. (28th-29th)
(The Weather Channel)
Return to DataStreme
ECS website
Prepared by Edward J. Hopkins, Ph.D., email hopkins@meteor.wisc.edu
© Copyright, 2014, The American Meteorological Society.