WEEKLY CLIMATE NEWS
DataStreme ECS WEEK FOUR: 21-25 September 2015
ITEMS
OF INTEREST
- The Autumnal Equinox --The Autumnal
Equinox will occur early this coming Wednesday morning
(officially at 0821Z on
23 September 2015 or 4:21 AM EDT or 3:21 AM CDT, etc.). At that time the
noontime sun will appear directly above the equator, representing one
of the two times during the year for such an occurrence, with the other
being at the vernal equinox in March. The term "equinox" arises from
the fact that this time of year represents "equal night" and equal day
essentially everywhere. Within the subsequent several days, the length
of daylight will become noticeably shorter. This decrease in daylight
will continue for another three months to the winter solstice during
the evening of Monday, 21 December 2015.
Editor's note: John White, a meteorologist from
North Carolina involved with the AMS Education program, reported that
the geosynchronous (or geostationary) satellites make an "satellite
eclipse" of the sun near the spring and autumnal equinoxes because of
their equatorial orbit, such that these satellites pass through the
earth's shadow and the satellite is powered down when the solar array
does not receive sufficient sunlight. [For more information, consult NWS
Southern Region GOES Satellite FAQ] EJH.
If you checked the sunrise and sunset times in your local newspaper or from the climate page at your local National Weather Service Office, you would probably find that not until the midpoint of this coming week will the length of time when the Sun is above the local horizon would be precisely 12 hours at most locations. However; the length of night will exceed that of the length of daylight by the end of the week. The effects of atmospheric refraction (bending of light rays by the varying density of the atmosphere) along with a relatively large diameter of the sun contribute to several additional minutes that the Sun appears above the horizon at sunrise and sunset. - Fall coloration -- By mid-September,
deciduous trees begin to turn color across the nation, starting first
across the higher elevations of New England and the Rocky Mountains,
followed quickly across sections of the upper Midwest. During autumn,
the peak in fall color progresses southward and toward lower
elevations. Some locales hold events in an effort to welcome tourists
who come as "leaf peepers." The Department of Agriculture's U.S.
Forest Service maintains a Fall Colors 2015 Web page containing fall foliage status
updates for National Forests across the continental United States.
Additional information is also available through the tourism bureaus of
the various states; links to some of these state sites are available
from this Forest Service web page.
[Editor's Note: An interesting explanation of fall
coloration can be found in The
Chemistry of Autumn Colors from "Science is Fun in
the Lab of Shakhashiri" from a popular chemistry educator at the
University of Wisconsin-Madison. EJH] - September is National Preparedness Month -- The month of September has been declared National Preparedness Month (NPM), which is aims to educate and empower Americans to prepare for and respond to all types of emergencies, including natural disasters. NPM is sponsored by the Federal Emergency Management Administration (FEMA), which has provided a toolkit of marketing materials to help promote the month, is the lead on this campaign that was originally launched in 2004. The theme for 2015 NPM is "Don't Wait. Communicate. Make Your Emergency Plan Today." During Week 4 (20-26 September), the weekly hazard-focused theme is "Power Outage." [FEMA's Ready.gov] NOAA's National Weather Service is working with FEMA to communicate the importance of emergency preparedness as a key component of its Weather-Ready Nation campaign. [NOAA Weather Ready Nation]s
- Free admission into the National Parks -- Next Saturday, 26 September 2015 has been designated by the National Park Service as fee-free day in honor of National Public Lands Day, which is celebrated annually at public lands across the nation. This fee waiver will cover entrance and commercial tour fees in many of the national parks and monuments administered by the Park Service. [National Park Service Fee Free Days]
The theme of National Public Lands Day 2015 is
"Helping Hands for American Lands" [National Environmental Education Foundation]
- Monitoring the seasonal motions of the sun -- If you would like more background information concerning how the sun
appears to across your local sky, along with the times of local sunrise
and local sunset, for your hometown on any day throughout year, please
read this week's Supplemental
Information�In Greater Depth.
CURRENT
CLIMATE STATUS
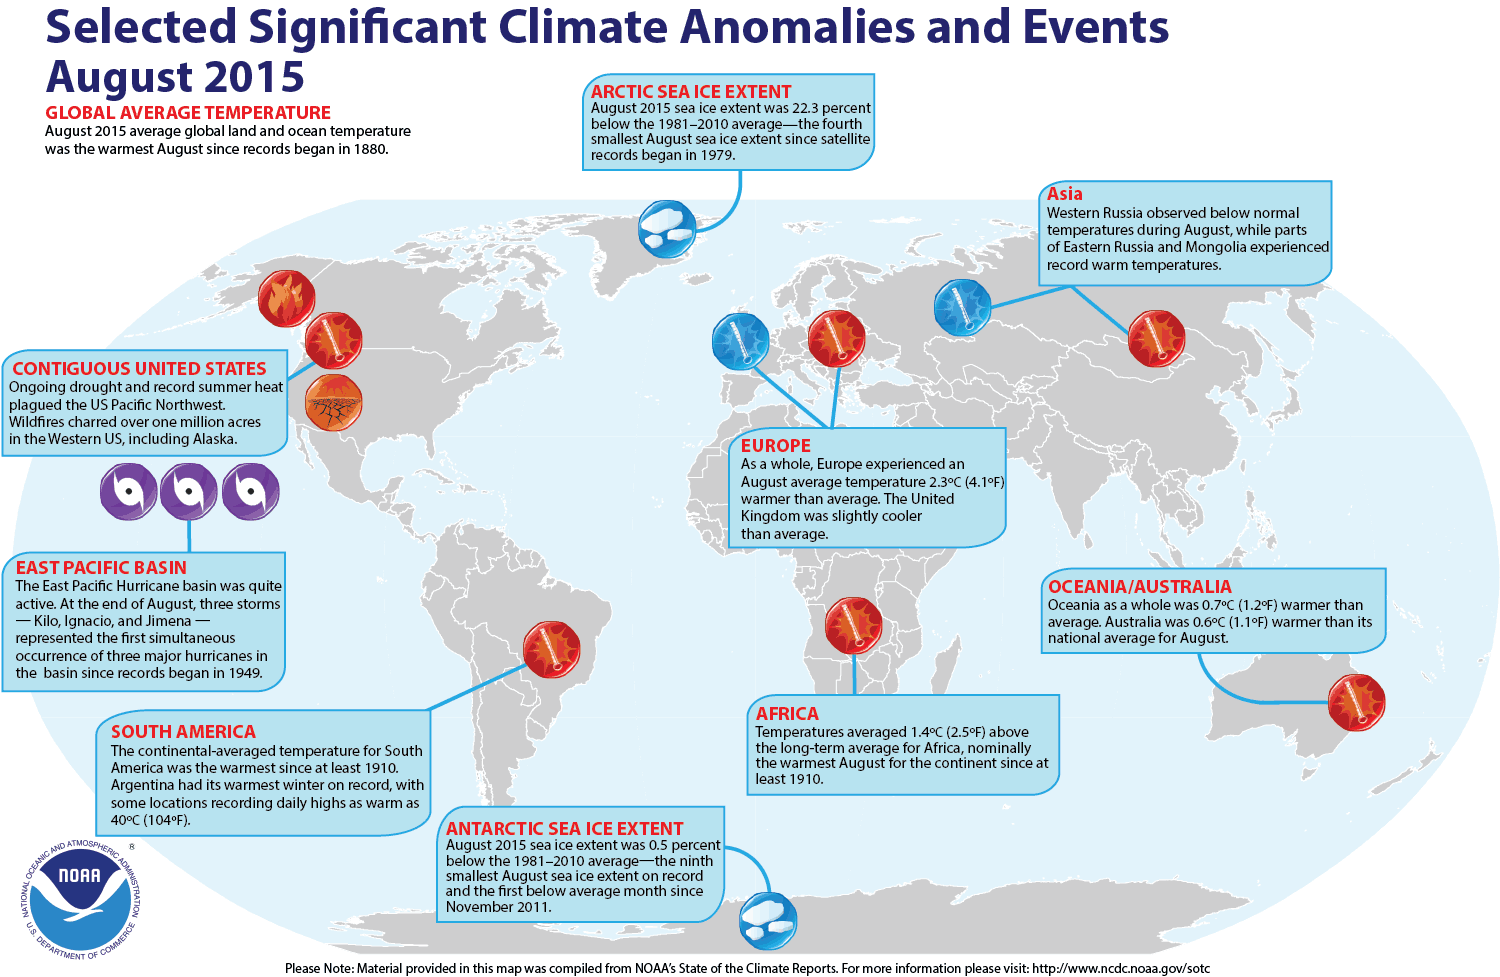
- Review of August 2015 (and seasonal) weather and climate for the globe -- Preliminary data analyzed by scientists at
NOAA's National Centers for Environmental Information (NCEI) indicated:
- The global
combined land and ocean average surface temperature for August 2015 was 1.58 Fahrenheit degrees above the 20th-century average (1901-2000) for
the month, which makes last month the warmest August since a sufficiently dense network of global temperature
records began in 1880. When considered separately, the monthly
temperature departure of the ocean
surface was 1.40 Fahrenheit degrees above the 20th-century average, which not only would be a record high for any August in the last 136 years, but represented the largest temperature departure for any month of the year, set the previous month of July 2014. The land surface surface temperature for this recently concluded month also was
the highest August temperature on record, with a monthly temperature that was approximately 2.05 Fahrenheit degrees above the 20th-century average. [NOAA/NCDC
State of the Climate]
- A global map of Selected Significant Climate Anomalies and Events for August 2015 is available from NCEI.
- The global land and ocean average temperature for the
three-months of June, July and August (meteorological summer in the
Northern Hemisphere) 2015 was also the highest for this three-month period
since 1880, as it was 1.53 Fahrenheit degrees above the 20th-century average. The June-August 2015 temperatures for both the ocean and land, when considered separately, were highest for any boreal summer in the last 136 years.
- According to data provided by
the National Snow and Ice Data Center, the average August Arctic sea ice extent was approximately 22.3 percent below the 1981–2010 average, making it the fourth smallest August Arctic sea ice extent since satellite records began in 1979. The August Antarctic sea ice extent was the ninth smallest August extent on record and marks the first month since November 2011 that had below average sea ice extent.
- Satellites monitor the drying of the West -- Maps were recently prepared of the soil moisture stored near the surface and below ground across the nation from data collected by the pair of Gravity Recovery and Climate Experiment (GRACE) satellites along with other satellites and ground-based measurements. These maps show the soil moisture at the surface, in the root zone and as ground water storage for start of last week, depicted as a percentage of soil moisture for these zones during mid-September averaged over the 1948 to 2012 interval. Long-term soil moisture shortages can be seen at all depths across many areas of the West where historic severe drought conditions continue especially in California over the last four years. [NASA Earth Observatory]
CURRENT
CLIMATE MONITORING
- Sea ice on Arctic Ocean reaches its smallest seasonal extent -- Scientists at NASA's Goddard Space Flight Center and National Snow and Ice Data Center have recently announced that the sea ice cover on the Arctic Ocean appeared to have shrunk to its smallest annual extent on 11 September 2015. Based on preliminary analysis of data collected by the Advanced Microwave Scanning Radiometer 2 (AMSR-2) sensor on Japan's Global Change Observation Mission 1st�Water ("Shizuku") satellite, the sea ice coverage on that date would represent the fourth smallest seasonal extent since satellite-based observations began in 1978. [NASA Earth Observatory]
- A partial opening in the Northwest Passage detected from space -- Images made from the Visible Infrared Imaging Radiometer Suite (VIIRS) on the NASA/NOAA Suomi NPP satellite and the Operational Land Imager (OLI) on NASA's Landsat 8 satellite at the end of August show ice-free channels between several of the Canadian Archipelago that would represent the southern route of the famous Northwest Passage. The Northwest Passage, which has been sought by explorers for centuries, is a sea route connecting the northern Atlantic and Pacific Oceans through sections of the Arctic Ocean. Until the last few decade, ice covered the waters of the Northwest Passage, making it impassable. [NASA Earth Observatory]
- Nation's large cities ranked on basis of heat island effect on temperature -- Researchers at the University of Georgia have developed a method for calculating the urban heat island intensities (UHI), which describes how the spatial configuration of cities, the materials in them, lack of vegetation and waste heat can modify the air temperature. The researchers applied this method to examine and rank the UHI values for 50 of the largest metropolitan areas across the nation, finding that Salt Lake City, UT; Miami, FL and Louisville, KY represent the top three urban heat island cities in the United States. [University of Georgia Today]
CLIMATE FORCING
- Soot measured from flaring of North Dakota oil and gas fields -- Researchers from NOAA, the Cooperative Institute for Research in Environmental Sciences and the University of Michigan made direct measurements of the black carbon that is a major component of the soot emanating from the flares that are part of the venting operations associated with the oil and gas extraction in the Bakken oil field of northwestern North Dakota and neighboring Saskatchewan. Measurements were made by instruments onboard the NOAA Twin Otter research aircraft in May 2014. The study reported that flaring was releasing an estimated four tons of black carbon per day, which was not considered significant for global climate as the amount emitted from the North Dakota flaring was less than one percent of all black carbon emitted per annum in North America. [NOAA Office of Oceanic and Atmospheric Research News]
CLIMATE
FORECASTS
- New Seasonal Climate Outlooks for the remainder of 2015 issued -- Near the end of last week, forecasters at the NOAA Climate Prediction Center (CPC) released their new national Three-Month (Seasonal) Climate Outlooks for October through December 2015, corresponding to the last two months of the meteorological autumn season (in the Northern Hemisphere) and the first month of meteorological winter. Specific details of their outlooks include:
- Temperature and precipitation outlooks -- According to their temperature outlook, many areas of the contiguous United States should experience a high chance of above average temperatures for the three upcoming months, especially along the East and West Coasts and the northern tier of states. The greatest probability of such an occurrence should be found along the West Coast from Washington southward to northern California, across the northern Great Lakes and the Northeast (New England and Middle Atlantic States) and across south Florida. Chances of above average temperatures for the last three months of 2015 also would be better than average across the northern Rockies and northern Plains as well as across sections of Southeast. Conversely, sections of the southern Plains in Texas and the southern Rockies i New Mexico could have a better than even chance of below average temperatures through the end of the year. The outlook indicates that the remainder of the nation extending from the Great Basin to the lower Mississippi Valley would have nearly equal chances of warmer or cooler than normal conditions.
The CPC precipitation outlook calls for a better than even chance for above average precipitation during the next three months across the southern tier of states running from Arizona to the Southeastern Atlantic Coast, with the best chances for wet weather being over southern Texas and most of the Florida Peninsula. On the other hand, most of the interior Northwest centered upon the northern Rockies and the northern Great Lakes eastward across Upstate New York and northern New England would have the best chances of below average precipitation through the end of the year. The remainder of the contiguous states were given essentially equal chances of below and above average precipitation for October through December 2015.
A summary of the prognostic discussion of the 3-month outlook for non-technical users is available from CPC. These forecasts were based in part that assuming that a strong El Niño event would continue, peaking during the Northern Hemisphere fall of 2015. A description is also provided as how to read these 3-class, 3-month Outlook maps.
- Seasonal Drought Outlook released -- The
forecasters at NOAA's Climate Prediction Center also released their US
Seasonal Drought Outlook last week that would run from late-September through December 2015. Their outlook would call for persistence of extensive drought conditions across many areas of the West, particularly across the Northwest (including Washington, Oregon and Idaho), northern and central California, a large section of the Great Basin (Nevada and Utah) and the northern Rockies. Expansion of the drought eastward across Montana was also possible. Drought was also expected to continue in scattered coastal areas of New England. Sections of the Southwest, the South Central States and the Southeast could see some improvement in drought conditions during the rest of the year, including some areas that could removed from drought listings. The remainder of the nation does not appear to be headed for drought conditions. Note: a Seasonal Drought Outlook Discussion is included describing the forecasters' confidence.
- Assessing likelihood of 2015 becoming Earth's warmest year on record -- In a blog written by researchers at the NOAA National Centers for Environmental Information, the topic of the likelihood of the calendar year of 2015 becoming the warmest year around the globe since sufficiently dense worldwide weather observing networks developed in 1880. Based upon the record-setting global temperatures through the first seven months of the year, together with an ongoing strong El Niño that should continue through the next several months, chances look extremely likely that this year would be a record-setter. [NOAA Climate.gov News]
PALEOCLIMATE RECONSTRUCTION
- Tree Ring Lab at Lamont-Doherty turns 40 -- During this month, the Tree Ring Lab at Lamont-Doherty Earth Observatory is celebrating its 40th anniversary. This lab collects and analyzes wood cores taken from trees around the world to reconstruct past climates, extending in some cases more than several thousand years. The lab has used a variety of new techniques to expand dendrochronology, the scientific method of dating past events based on the analysis of patterns of tree rings. [Lamont-Doherty Earth Observatory News]
CLIMATE
AND SOCIETY
Concept of the Week: Climate and
Architecture
Humans have been constructing houses and other buildings for
thousands of years not only to protect themselves from the weather and
other environmental factors, but also to create a comfortable indoor
environment that would exhibit energy efficiency, especially in harsh
climates. For centuries, natural or primitive housing reflected an
adaptation to the climate of the locale and the availability of local
building materials.
In order to maintain a tolerable level of comfort within a
building, attention must be paid to thermal effects, ventilation,
illumination and atmospheric humidity.
The indoor thermal state ultimately depends upon the
building's energy budget involving incoming and outgoing radiation,
latent and sensible heat loss and by interior heat sources or sinks.
The indoor thermal level is mainly associated with the external energy
load on the building. The external energy load on the building depends
upon the latitude of the building, season of the year and time of day.
In tropical latitudes and during midday hours in summer, the
sun's path across the local sky increases the solar radiation incident
upon the roof and walls of the building. In polar latitudes, or during
the winter or the amount of available sunlight is significantly lower,
with the loss of infrared radiation causing a net cooling from the
building. Changes in the color of the roof and the outer walls can
affect the amount of incoming sunlight absorbed. Building orientation
and the effective use of overhangs can also affect the amount of
sunlight absorbed. Furthermore, the amount of insulation, often related
to the thickness of the walls, reduces the conduction of heat into or
out of the building. Thick adobe walls have been used effectively in
the Southwest to moderate indoor temperature. These walls reduce the
heat flow into the building during the daytime and in summer and out
from the building at night or during winter.
The size and placement of windows also affects the energy
balance. Large windows on the side of the building facing the sun's
path tend to permit large amounts of sunlight to penetrate into the
building. However, large windows on the side facing away from the sun
can cause for heat loss due to conduction, as many types of windowpanes
are not energy efficient.
Effective landscaping can reduce energy demands upon a
dwelling: Deciduous trees planted on the south and west sides of the
home provide cooling shade during the summer, keeping sunlight from
entering the windows. These trees will lose their foliage in fall and
allow the sun to shine through in winter, and warm south facing rooms.
Evergreen trees or dense shrubbery on the north side can serve as a
windbreak, which reduce the cold northerly winds from striking the
house in winter.
Energy losses from buildings during the upcoming winter in
northern latitudes can be seen readily by how quickly snow melts from
roofs and by how big the icicles form. Heat losses from buildings occur
with larger negative energy budgets, which are reflected also in higher
heating bills during the winter season. However, the heating bills also
depend upon the severity of the winter season that can be ascertained
from the number of accumulated heating degree-day units. Check this
week's AMS Weather Studies Supplemental Information...In
Greater Depth for how you can monitor the number of heating
degree-day units to date in your state for this coming heating season.
Concept of the Week: Questions
Place your responses on the Chapter Progress Response Form
provided in the Study Guide.
- The thicker the outdoor walls, the [(greater),(less)] the heat flow into or out of a building.
- Planting [(evergreen),(deciduous)] vegetation on the south side of a home in New England
will help reduce winter heating and summer cooling bills.
Historical Events:
- 22 September 1913...Des Moines, IA experienced their
earliest freeze of record. (The Weather Channel)
- 22 September 1934...Edmonton, Alberta reported its greatest
September snowstorm to date with 8.7 inches of snow. (The Weather
Doctor).
- 23 September 1904...The temperature at Charlotteburg, NJ
dipped to 23 degrees, the lowest reading of record for so early in the
autumn for the state. (The Weather Channel)
- 24 September 1888...The earliest frost of record hit the
southern states covering South Carolina, Georgia and northern Florida
(Intellicast)
- 24 September 1926...The temperature at Riverside Ranger
Station in Yellowstone Park dipped to nine degrees below zero, the
lowest reading of record in the U.S. during September. (This record was
broken by a 15 degree below zero reading at Big Piney, WY in September
1983.) Severe freezes were widespread over the northwestern U.S.
causing great crop destruction. In Washington State, Spokane County
experienced their earliest snow of record. Harney Branch Experiment
Station in Oregon reported a temperature of 2 degrees above zero to
establish a state record for the month of September. (David Ludlum)
(The Weather Channel)
- 24-26 September 1950...A smoke pall from western Canada
forest fires covered much of the eastern U.S. Daylight was reduced to
nighttime darkness in parts of the Northeast. The color of the sun
varied from pink to purple, blue, or lavender. Yellow to gray-tan was
common. (24th-30th) On the 26th, residents of the northeastern U.S.
observed a blue sun and a blue moon from the smoke. (David Ludlum) (The
Weather Channel)
- 25 September 1939...A West Coast hurricane moved onshore
south of Los Angeles bringing unprecedented rains along the southern
coast of California. Nearly five and a half inches of rain drenched Los
Angeles during a 24-hr period. The hurricane caused $2 million in
damage, mostly to structures along the coast and to crops, and claimed
45 lives at sea. "El Cordonazo" produced 5.66 in. of rain at Los
Angeles and 11.6 in. of rain at Mount Wilson, both records for the
month of September. (David Ludlum) (The Weather Channel)
- 26 September 1963...San Diego, CA reached an all-time
record high of 111 degrees. Los Angeles hit 109 degrees. (David Ludlum)
- 27 September 1816...A black frost over most of New England
kills unripened corn in the north resulting in a year of famine. (David
Ludlum)
- 27-28 September 1953...The strongest wind gust ever
recorded during a hurricane was 175 mph at Chetumal, Mexico. (The
Weather Doctor)
Return to DataStreme ECS RealTime Climate Portal
Prepared by Edward J. Hopkins, Ph.D., email hopkins@meteor.wisc.edu
© Copyright, 2015, The American Meteorological Society.