WEEKLY CLIMATE NEWS
24-28 September 2018
ITEMS
OF INTEREST
- Looking back one year to Hurricane Maria -- During the last two weeks of September 2017, a major hurricane named Maria traveled westward across the tropical waters of the North Atlantic and the Caribbean before curving to the north and finally to the east-northeast. Starting as a tropical storm to the east of the Lesser Antilles on 16 September 2017, Maria strengthened to become a category 5 hurricane on the Saffir-Simpson Scale two days later before making landfall on Dominica. Although weakening slightly after traveling across Dominica, Maria reached its peak intensity over the eastern Caribbean with maximum sustained surface winds of 175 mph surrounding its center. With these winds and a central minimum pressure of 908 millibars (or 25.81 inches of mercury), Maria represents the tenth-most intense Atlantic hurricane on record and the most intense tropical cyclone worldwide in 2017. Maria then struck Puerto Rico as a category 4 hurricane on 20 September with winds of 155 mph. Weakening after crossing across Puerto Rico, Maria passed to the north of Hispanola on the 22nd before curving to the north and passing offshore of the U.S. East Coast by the 25th. Eventually, Maria weakened to a tropical storm on 28 September as it was carried toward the east-northeast, loosing its tropical characterstics and becoming an extratropical cyclone on the 30th. As many as 3057 fatalities can be attributed to Maria, with a recently revised official death toll of 2975 in Puerto Rico [Huffington Post]. Therefore, Maria has been declared the deadliest Atlantic hurricane since Hurricane Jeanne in 2004 and it has been tabulated as the third-costliest Atlantic hurricane ($91.6 billion in damage). [National Hurricane Center ]
- September is National Preparedness Month -- The month of September has been declared National Preparedness Month (NPM), which is aims to educate and empower Americans to prepare for and respond to all types of emergencies, including natural disasters. NPM is managed and sponsored by the Federal Emergency Management Administration's (FEMA) Ready Campaign in conjunction with the Ad Council. A toolkit of marketing materials is provided to help promote the month and represents the lead on this campaign that was originally launched in 2004. The overarching theme for 2018 NPM is "Disasters Happen. Prepare Now. Learn How" with an emphasis on planning. Week 4 of the 2018 NPM (23-29 September) has the theme "Save For an Emergency."
[FEMA's Ready.gov]
- World Environmental Health Day to focus on air quality -- This Wednesday (26 September 2018) has been declared World Environmental Health Day by the International Federation of Environmental Health. This event is celebrated each year. The theme for the 2018 World Environmental Health Day is "Global Food Safety and Sustainability," which intended to provide more safe food and to make use of precious water and nutrient resources. In addition, support is for communities to increasingly value sustainable food production.
World Health Organization (WHO) claims that poor quality air affects more than 80% of the world's population. [International Federation of Environmental Health]
- End of the growing season -- If you live
in the northern portion of the country, the growing season may have
already ended as cold air masses have moved southeastward from Canada.
Check the interactive maps produced by the Midwestern Regional Climate Center's Vegetation Impact Program (VIP) that show the date of the first occurrence of 28-degree and 32-degree Fahrenheit temperature readings during this fall across the 48 coterminous United States. (Use the "Current Season Freezes" in the "Shaded Maps Menu" on left to select the desired map.) Comparison can be made with corresponding maps showing the median dates of occurrence of the first 32-degree (or 28-degree) Fahrenheit
temperatures (in the appropriate "Climatologies" sections) across the lower 48 states based upon a 30-year time series. (The median date
means that half of the occurrences of a 32-degree reading over the
30-year normal occur prior to this date, while the other half occur
after this date.) Additional other freeze-climatology maps are available including the earliest and latest dates of first autumnal freeze. Following first frost, some delightful days should
occur during October and early November in what is often called "Indian
Summer."
- Monitoring degree-day units -- If you
would like to monitor how this upcoming winter will affect the amount
of energy that you will need for heating your home, please read this
week's Supplemental Information...In
Greater Depth. You will see how heating degree-day units are
computed, as well as the corresponding cooling-degree day units. This
supplemental also provides links to tabulations of the cumulative
heating and cooling degree-day units that are available on a monthly
basis for selected cities across the country.
CURRENT CLIMATE
STATUS
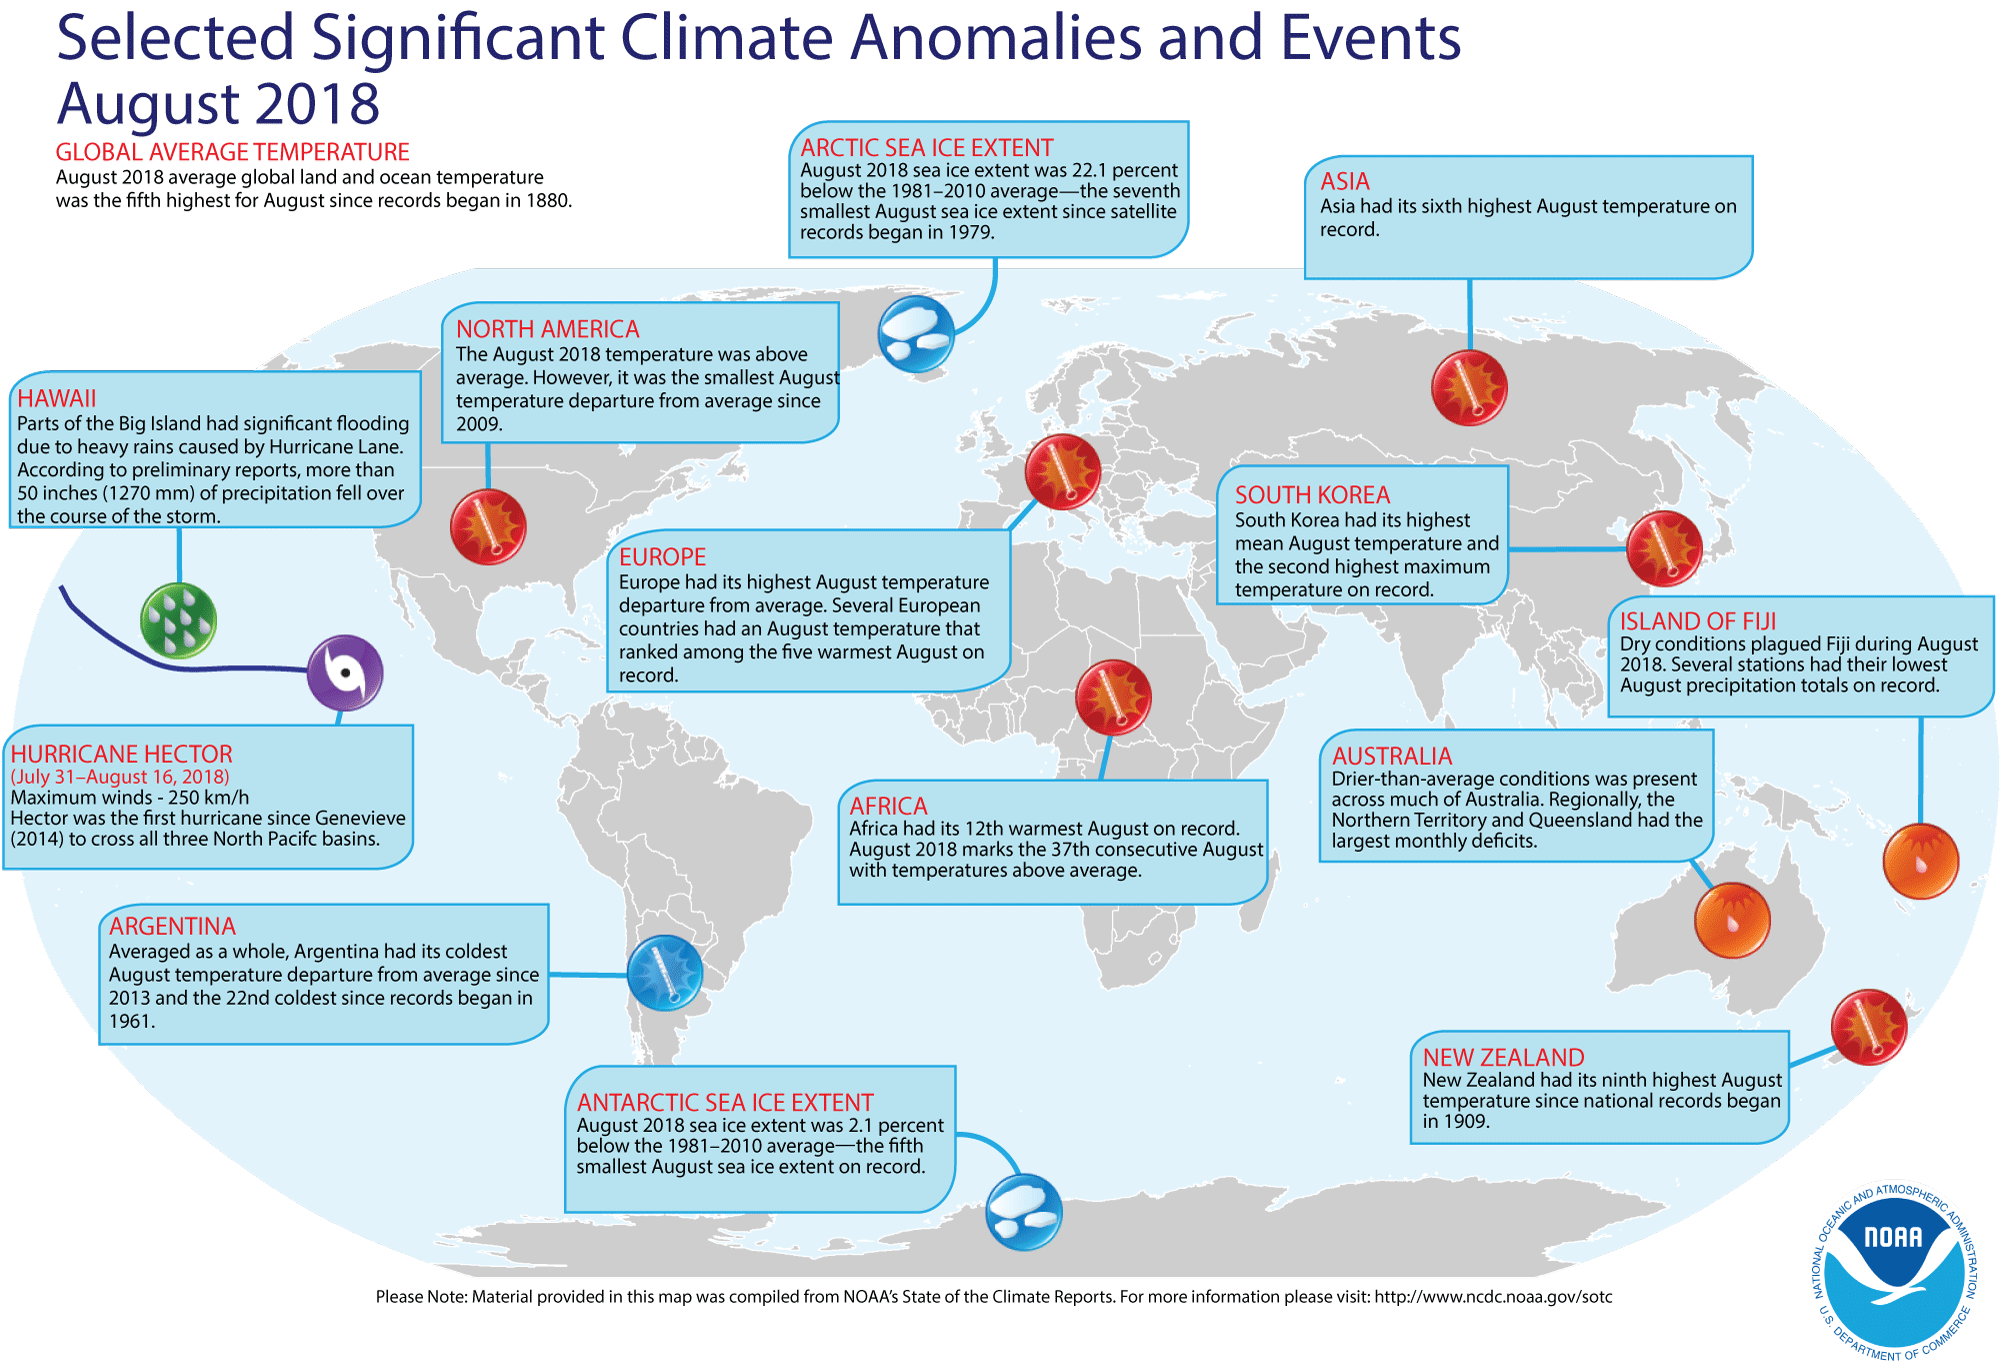
- Review of August 2018 (and seasonal) weather and climate for the globe -- Preliminary data analyzed by scientists at
NOAA's National Centers for Environmental Information (NCEI) indicated:
- The global combined land and ocean average surface temperature for August 2018 was 1.33 Fahrenheit degrees above the 20th-century average (1901-2000) for
the month, which makes last month the fifth warmest August since a sufficiently dense network of global temperature records began in 1880; the warmest August on record was August 2016, which was 1.62 Fahrenheit degrees above the 1901-2000 average. When considered separately, the land surface temperature for this recently concluded month was the sixth highest August temperature in the 139-year record, with a monthly temperature that was approximately 1.69 Fahrenheit degrees above the 20th-century average. The August 2018 monthly temperature departure of the ocean surface was 1.21 Fahrenheit degrees above the 20th-century average, which was the fifth highest August temperature on record. ENSO-neutral conditions prevailed during August 2018, with slightly above average sea surface temperatures found across the central and eastern equatorial Pacific Ocean.
NOTE: Climate scientists prefer to generate long-time series of global temperatures using temperature anomalies (or the arithmetic differences between the observed monthly temperatures and the corresponding long-term 20th century averages), as a better means for gathering information in data-sparse areas or where missing station data present a problem. [NOAA Climate.gov News]
- A global map of Selected Significant Climate Anomalies and Events for August 2016 is available from NCEI.
- During the last three months, which constitutes meteorological summer in the Northern Hemisphere and meteorological winter in the Southern Hemisphere, the
combined global land and ocean average temperature for June-August 2018 was 1.33 Fahrenheit degrees above the 20th-century average, which also was the fifth highest for this three-month period since 1880. The June-August 2018 temperature for the global land surface was the fifth highest for any boreal summer in the last 139 years, while the three-month average ocean temperature tied the corresponding months in 2009 as being the fifth highest.
- According to data provided by the National Snow and Ice Data Center (NSIDC), the average August Arctic sea ice extent in the Northern Hemisphere was approximately 22 percent below the 1981–2010 average, making it the seventh smallest August Arctic sea ice extent since satellite records began in 1979. In the Southern Hemisphere, the August 2018 Antarctic sea ice extent was the fifth smallest August extent in the 40-year period of record.
[NOAA/NCDC
State of the Climate]
CLIMATE
MONITORING
- New ICESat-2 satellite successfully launched -- During the predawn hours of Saturday, 15 September 2018, NASA's Ice, Cloud and land Elevation Satellite-2 (ICESat-2) was successfully launched into a polar orbit from the Vandenberg Air Force Base in southern California with a mission to measure the Earth's ice sheet mass balance and sea ice thickness. In addition, this satellite is intended to measure cloud as well as land topography and vegetation characteristics. ICESat-2, which follows the original ICESat that operated from 2003 to 2009, is designed to measure the Earth's ice elevation in the polar regions from an orbital altitude of approximately 290 miles with unprecedented accuracy. The satellite has a single instrument called the Advanced Topographic Laser Altimeter System (ATLAS) that will collect data needed to estimate the annual height change of the Greenland and Antarctic ice sheets to within four millimeters. [NASA Earth Observatory]
CLIMATE FORCING
- Increases in atmospheric humidity across the nation have led to "Big Rain" events -- Derek Arndt, Chief of the Climate Monitoring Branch at NOAA's NCEI, posted a blog on the "Beyond the Data" site discussing the large quantities of precipitation that accumulated across many areas of the 48 contiguous United States during the first eight months of the year. The January-August 2018 accumulated precipitation would be in the top ten percent of the period of record extending back to 1895 across sections of the Middle Atlantic and the Midwest; some locations were close to record accumulation totals. He also noted that some of the wet weather can be associated with what he calls "Big Rain" events, which have been increasing across the nation over the last few decades. He attributes these excessive rain events to increases in atmospheric humidity (water vapor) resulting from increasing temperatures. Using the definition from the National Climate Assessment, a "Big Rain" event is one where the accumulation would be within the top one percent of daily totals from the reference period of 1961-90. He traced some of the increases in these events across the Southeast over the last several decades to more intense and slower moving tropical cyclones spreading torrential rains across the region. [NOAA Climate.gov News]
- Three causes of Earth's spin axis drift are identified -- NASA scientists and colleagues from Germany, Norway and Denmark have identified three broadly-categorized processes responsible for the drift and wobble observed in the Earth's spin axis that is referred to as "pole motion." Based upon 20th century observations, this spin-axis drift has been determined to occur at a rate of about 4 inches (10 centimeters) per year. The researchers attribute the three causes to: ice mass loss primarily in Greenland, post glacial rebound, and deep mantle convection. [NASA Jet Propulsion Laboratory News]
CLIMATE FORECASTS
- New Seasonal Climate Outlooks for the remainder of 2018 issued -- Forecasters at the NOAA Climate Prediction Center (CPC) recently released their new national Three-Month (Seasonal) Climate Outlooks for October through December 2018, corresponding to the last two months of the meteorological autumn season (in the Northern Hemisphere) and the first month of meteorological winter. Specific details of their outlooks include:
- Temperature and precipitation outlooks -- According to their temperature outlook, more than 95 percent of the contiguous United States should experience a high chance of above average temperatures for the three upcoming months. The greatest probability of such an occurrence should be found across the Southwest, centered upon the Four Corners (Arizona, Colorado, New Mexico and Utah). Northern New England and Upstate New York were also expected to have a good chance of above average temperatures. The outlook indicates that a small section of the Southeast, stretching across northern Florida and sections of Alabama, Georgia and South Carolina would have nearly equal chances of warmer or cooler than normal conditions. All of Alaska should have above average temperatures through the end of the year, with the greatest chances being across western and northwestern sections, especially on the Seward Peninsula.
The CPC precipitation outlook calls for a better than even chance for below average precipitation during the next three months across northwestern quadrant of the contiguous U.S., with the greatest probability of drier than average conditions being centered on interior sections of Washington and Oregon, the Idaho Panhandle and northwestern Montana. On the other hand, the southern and eastern sections of the nation, stretching from southern California eastward to Florida and northward to southern New England would have a good chance of above average precipitation through the end of the year. Areas along the Rio Grande in New Mexico and Texas, the entire U.S. Gulf Coast and the Florida Peninsula northward to coastal South Carolina should have the best chances for wet weather. The remainder of the contiguous states were given essentially equal chances of below and above average precipitation for October through December 2018. The entire state of Alaska could experience above average precipitation during the next three months, especially along the Seward Peninsula and surrounding areas.
A summary of the prognostic discussion of the 3-month outlook for non-technical users is available from CPC. These forecasts were based in by assuming current ENSO-neutral conditions (with neither an El Niño or La Niña conditions) would possibly transition into weak El Niño conditions during the remainder of meteorological autumn in the Northern Hemisphere.
A description is also provided as how to read these 3-class, 3-month Outlook maps.
- Seasonal Drought Outlook released -- The
forecasters at NOAA's Climate Prediction Center also released their US
Seasonal Drought Outlook last week that would run from late-September through December 2018. Their outlook would call for persistence of extensive drought conditions across the northern Plains, the interior Northwest and a large area of the Southwest, extending from southeastern Colorado westward across the Four Corners to southern California. Drought conditions were also expected to develop across sections of the Tennessee Valley in Alabama. On the other hand, a few sections of the Northwest, the southern Plains, the southern Rockies, the lower Missouri Valley and northern sections of Upstate New York and Vermont Plains could see some improvement in drought conditions during the rest of the year, including some areas that could be removed from drought listings. The remainder of the nation does not appear to be headed for drought conditions. Note: a Seasonal Drought Outlook Discussion is included describing the forecasters' confidence.
CLIMATE
AND SOCIETY
- Estimating the chances of being hit by a hurricane along the U.S. coast -- NOAA's National Hurricane Center is using an analysis tool that quantifies the frequency at which a hurricane can be expected to pass within 50 nautical miles of a specific location, expressed as the "hurricane return period." Thus, a return period of 20 years for a major Category 3 or stronger hurricane on the Saffir-Simpson Scale means that on average during the previous 100 years, a major hurricane passed within 50 nautical miles of that location about five times. NOAA's National Ocean Service provides an online tool that allows users to track the paths of historic hurricanes back to 1851, while NOAA's 2018 Atlantic and Pacific Hurricane Trackers permit tracking of current hurricanes from NOAA satellite in essentially real time. [NOAA Stories]
- Earthweek -- Diary of the Planet [earthweek.com]
Concept of the Week: Climate and
Architecture
Humans have been constructing houses and other buildings for
thousands of years not only to protect themselves from the weather and
other environmental factors, but also to create a comfortable indoor
environment that would exhibit energy efficiency, especially in harsh
climates. For centuries, natural or primitive housing reflected an
adaptation to the climate of the locale and the availability of local
building materials.
In order to maintain a tolerable level of comfort within a
building, attention must be paid to thermal effects, ventilation,
illumination and atmospheric humidity.
The indoor thermal state ultimately depends upon the
building's energy budget involving incoming and outgoing radiation,
latent and sensible heat loss and by interior heat sources or sinks.
The indoor thermal level is mainly associated with the external energy
load on the building. The external energy load on the building depends
upon the latitude of the building, season of the year and time of day.
In tropical latitudes and during midday hours in summer, the
sun's path across the local sky increases the solar radiation incident
upon the roof and walls of the building. In polar latitudes, or during
the winter or the amount of available sunlight is significantly lower,
with the loss of infrared radiation causing a net cooling from the
building. Changes in the color of the roof and the outer walls can
affect the amount of incoming sunlight absorbed. Building orientation
and the effective use of overhangs can also affect the amount of
sunlight absorbed. Furthermore, the amount of insulation, often related
to the thickness of the walls, reduces the conduction of heat into or
out of the building. Thick adobe walls have been used effectively in
the Southwest to moderate indoor temperature. These walls reduce the
heat flow into the building during the daytime and in summer and out
from the building at night or during winter.
The size and placement of windows also affects the energy
balance. Large windows on the side of the building facing the sun's
path tend to permit large amounts of sunlight to penetrate into the
building. However, large windows on the side facing away from the sun
can cause for heat loss due to conduction, as many types of windowpanes
are not energy efficient.
Effective landscaping can reduce energy demands upon a
dwelling: Deciduous trees planted on the south and west sides of the
home provide cooling shade during the summer, keeping sunlight from
entering the windows. These trees will lose their foliage in fall and
allow the sun to shine through in winter, and warm south facing rooms.
Evergreen trees or dense shrubbery on the north side can serve as a
windbreak, which reduce the cold northerly winds from striking the
house in winter.
Energy losses from buildings during the upcoming winter in
northern latitudes can be seen readily by how quickly snow melts from
roofs and by how big the icicles form. Heat losses from buildings occur
with larger negative energy budgets, which are reflected also in higher
heating bills during the winter season. However, the heating bills also
depend upon the severity of the winter season that can be ascertained
from the number of accumulated heating degree-day units. Check this
week's Supplemental Information...In
Greater Depth for how you can monitor the number of heating
degree-day units to date in your state for this coming heating season.
Historical Events:
- 24 September 1888...The earliest frost of record hit the
southern states covering South Carolina, Georgia and northern Florida
(Intellicast)
- 24 September 1926...The temperature at Riverside Ranger
Station in Yellowstone Park dipped to nine degrees below zero, the
lowest reading of record in the U.S. during September. (This record was
broken by a 15 degree below zero reading at Big Piney, WY in September
1983.) Severe freezes were widespread over the northwestern U.S.
causing great crop destruction. In Washington State, Spokane County
experienced their earliest snow of record. Harney Branch Experiment
Station in Oregon reported a temperature of 2 degrees above zero to
establish a state record for the month of September. (David Ludlum)
(The Weather Channel)
- 24-26 September 1950...A smoke pall from western Canada
forest fires covered much of the eastern U.S. Daylight was reduced to
nighttime darkness in parts of the Northeast. The color of the sun
varied from pink to purple, blue, or lavender. Yellow to gray-tan was
common. (24th-30th) On the 26th, residents of the northeastern U.S.
observed a blue sun and a blue moon from the smoke. (David Ludlum) (The
Weather Channel)
- 25 September 1939...A West Coast hurricane moved onshore
south of Los Angeles bringing unprecedented rains along the southern
coast of California. Nearly five and a half inches of rain drenched Los
Angeles during a 24-hr period. The hurricane caused $2 million in
damage, mostly to structures along the coast and to crops, and claimed
45 lives at sea. "El Cordonazo" produced 5.66 in. of rain at Los
Angeles and 11.6 in. of rain at Mount Wilson, both records for the
month of September. (David Ludlum) (The Weather Channel)
- 26 September 1963...San Diego, CA reached an all-time
record high of 111 degrees. Los Angeles hit 109 degrees. (David Ludlum)
- 27 September 1816...A black frost over most of New England
kills un-ripened corn in the north resulting in a year of famine. (David
Ludlum)
- 27-28 September 1953...The strongest wind gust ever
recorded during a hurricane was 175 mph at Chetumal, Mexico. (The
Weather Doctor)
- 28 September 1893...Albuquerque, NM was soaked with 2.25
inches of rain, enough to establish a 24-hour record for that city.
(The Weather Channel)
- 28 September 1986...Torrential rains and floods were
responsible for South Africa's worst natural disaster in Natal. As much
as 35 in. of rain fell between the 25th and 29th to the northeast of Empangen, resulting in 317 deaths and 163 people
missing. Topsoil from some farms was completely washed away leaving
only bedrock. (Accord Weather Calendar)
- 30 September 1992...Fairbanks, AK averaged a frigid 31.7
degrees for the month, 13.2 Fahrenheit degrees below normal and a record.
Beginning on the 9th, a record low was set for
every day of the month. The temperature plunged to 3 degrees on the 30th,
the lowest ever for September. Snowfall for the month totaled 24.4
inches, more than three times the previous record. The snows never
melted. Plant foliage still green, was frozen into place and week-long
power outages occurred as whole trees bent over onto power lines in the
heavy wet snow. (Intellicast)
Return to RealTime Climate Portal
Prepared by Edward J. Hopkins, Ph.D., email hopkins@aos.wisc.edu
© Copyright, 2018, The American Meteorological Society.