WEEKLY CLIMATE NEWS
DataStreme ECS WEEK TEN: 1-5 April 2013
ITEMS OF
INTEREST
- High-quality maps of April temperature and precipitation normals across US available -- The PRISM Climate Group at Oregon State University has prepared high-resolution maps depicting April's normal maximum temperature, minimum temperature and precipitation totals across the 48 coterminous United States for the current 1981-2010 climate normals interval. These maps, with a 800-meter resolution, were produced using the PRISM (Parameter-elevation Regressions on Independent Slopes Model) climate mapping system.
- April weather calendar for a city near you -- The Midwestern Regional Climate Center maintains an interactive website that permits the public to produce a ready to print weather calendar for any given month of the year, such as April, at any of approximately 270 weather stations around the nation. (These stations are NOAA's ThreadEx stations.) The entries for each day of the month includes: Normal maximum temperature, normal minimum temperature, normal daily heating and cooling degree days, normal daily precipitation, record maximum temperature, record minimum temperature, and record daily precipitation; the current normals for 1981-2010.
- Update on the Cherry Blossom Watch
-- Many tourists descend upon Washington, DC during the
spring to view the sights, including the blossoming cherry trees that
line the Tidal Basin along the Potomac River. The National Park service
operates a website
that reports the status of the cherry blossoms in anticipation of the
101st annual Cherry Blossom Festival that is scheduled to continue through next week (Sunday, 7 April 2013). This site also has
a listing of the phenological observations for past bloom dates.
According to a recent update, experts expect that the trees should reach peak bloom at the end of this week (Friday, 5 April) because of the recent spell of cold weather that even included snow. [Capital Weather Gang]
Analysis of the 90-year time series of the dates of peak bloom indicates that peak bloom dates have shifted five days earlier now as compared with just after World War I. The earlier dates appear related to increased March temperatures. [Capital Weather Gang]
- Development of long-term state, national and global instrumental climate records
-- Temperature and precipitation data have been collected
around the world since the mid-19th century. Beginning in the 1890s, a
sufficiently dense climate network has been established in the United
States and its territories. The records from around the nation and from
around the global have been collected and archived at several central
locations, such as NOAA's National Climatic Data Center (NCDC).
Scientists at NCDC along with colleagues at NASA's Goddard Institute
for Space Studies and in the United Kingdom have produced time series
of area-average monthly and annual temperatures for over a century on
state, national and global space scales. For more details on these
records and how to access them, please read this week's Supplemental Information...In Greater Depth.
CURRENT
CLIMATE STATUS
- Arctic sea ice reaches a winter maximum -- Scientists at the National Snow and Ice Data Center reported that their analysis of satellite data has indicated sea ice on the Arctic Ocean reaching its maximum seasonal extent on 15 March 2013. Soon thereafter, the ice cover began to contract and should continue to shrink to a minimum extent in September. The date of this year's maximum ice extent occurred five days later than the average date of 10 March as ascertained from the 1979-2000 interval. This year's maximum areal extent was the sixth lowest in the satellite record. [NOAA Environmental Visualization Laboratory]
- Explaining the recent invasion of arctic air across the eastern North America -- Using climate reanalysis data obtained from NOAA's National Centers for Environmental Prediction (NCEP) for the time span running from 25 February through 25 March 2013, an image of the sea-level pressure anomaly was constructed. This high pressure anomaly (or difference between observed and long-term average pressure) shows an area of anomalously high pressure over Greenland, which illustrates the negative phase of the Arctic Oscillation where high pressure blocks Arctic air from moving eastward. The cold air spread southward across eastern Canada and the US. [ NOAA Environmental Visualization Laboratory]
CURRENT CLIMATE
MONITORING
- Antarctic Peninsula experiencing a longer summer melt season -- Using data collected from 30 weather stations on the Antarctic Peninsula, Researchers with the British Antarctic Survey have determined that the summer melt season has increased over the last 60 years. Temperatures on the Peninsula have increased by nearly three Celsius degrees in this span, three times the global average. The rapid break-up of ice shelves in the area and rising sea level have been linked to this increased summer melt. [British Antarctic Survey]
- Tracking nitrogen dioxide over land and sea from space -- Scientists at NASA's Goddard Space Flight Center have produced several images made from data collected by the OMI (Ozone Monitoring Instrument) onboard a NASA's Aura satellite that reveal concentrations of tropospheric nitrogen dioxide (NO2) over the Indian Ocean and South Asia. Tracks of NO2 can be seen over the shipping lanes in the northern Indian Ocean, while larger concentrations of NO2 can be found across highly populated areas of South Asia. [NASA Earth Observatory]
- An All-Hazards Monitor -- This Web
portal provides the user information from NOAA on current environmental
events that may pose as hazards such as tropical weather, fire weather,
marine weather, severe weather, drought and floods. [NOAAWatch]
- Global and US Hazards/Climate Extremes -- A
review and analysis of the global impacts of various weather-related
events, including drought, floods and storms during the current month. [NCDC]
CLIMATE
FORCING
- Earth may be close to inner edge of Sun's "habitable zone" -- According to planetary scientists from the US and France, planet Earth appears to be closed to the inner edge of the Sun's so-called "habitable zone" than previously thought. This habitable zone is a region surrounding the Sun in which an orbiting planet could have temperatures that would permit sufficient amounts of liquid water to exist at its surface to support the development of life and sustain it. The researchers warn that if Earth were closer in terms of the habitable zone, a "moist greenhouse" climate could result that would cause further drastic changes to the atmosphere. [Institute of Physics]
- Volcanic eruptions may be offsetting global warming trends -- Researchers at the University of Colorado, Boulder and colleague with NASA, NOAA and the National Center for Atmospheric Research claim that increases in stratospheric aerosols due to volcanic eruptions since 2000 appear to be responsible for counterbalancing the increased warming that was projected during this past decade because of emissions of greenhouse gases by human activity. According to their analysis of the changes in the transparency of the stratosphere, the sulfur dioxide emitted by volcanoes help create a stratospheric aerosol layer at altitudes between 12 to 20 miles. [University of Colorado, Boulder]
- A "lubricant" discovered for Earth's tectonic plates -- Scientists at Scripps Institution of Oceanography who participated in an expedition off the coast of Nicaragua discovered a magma layer of liquefied molten rock in Earth's mantle at the Middle America trench that may serve as a "lubricant" for the sliding motions of the planet's massive tectonic plates. The scientists claim that their discovery may carry far-reaching implications, from solving basic geological functions of the planet to a better understanding of volcanism and earthquakes. [University of California, San Diego News Center]
CLIMATE FORECASTS
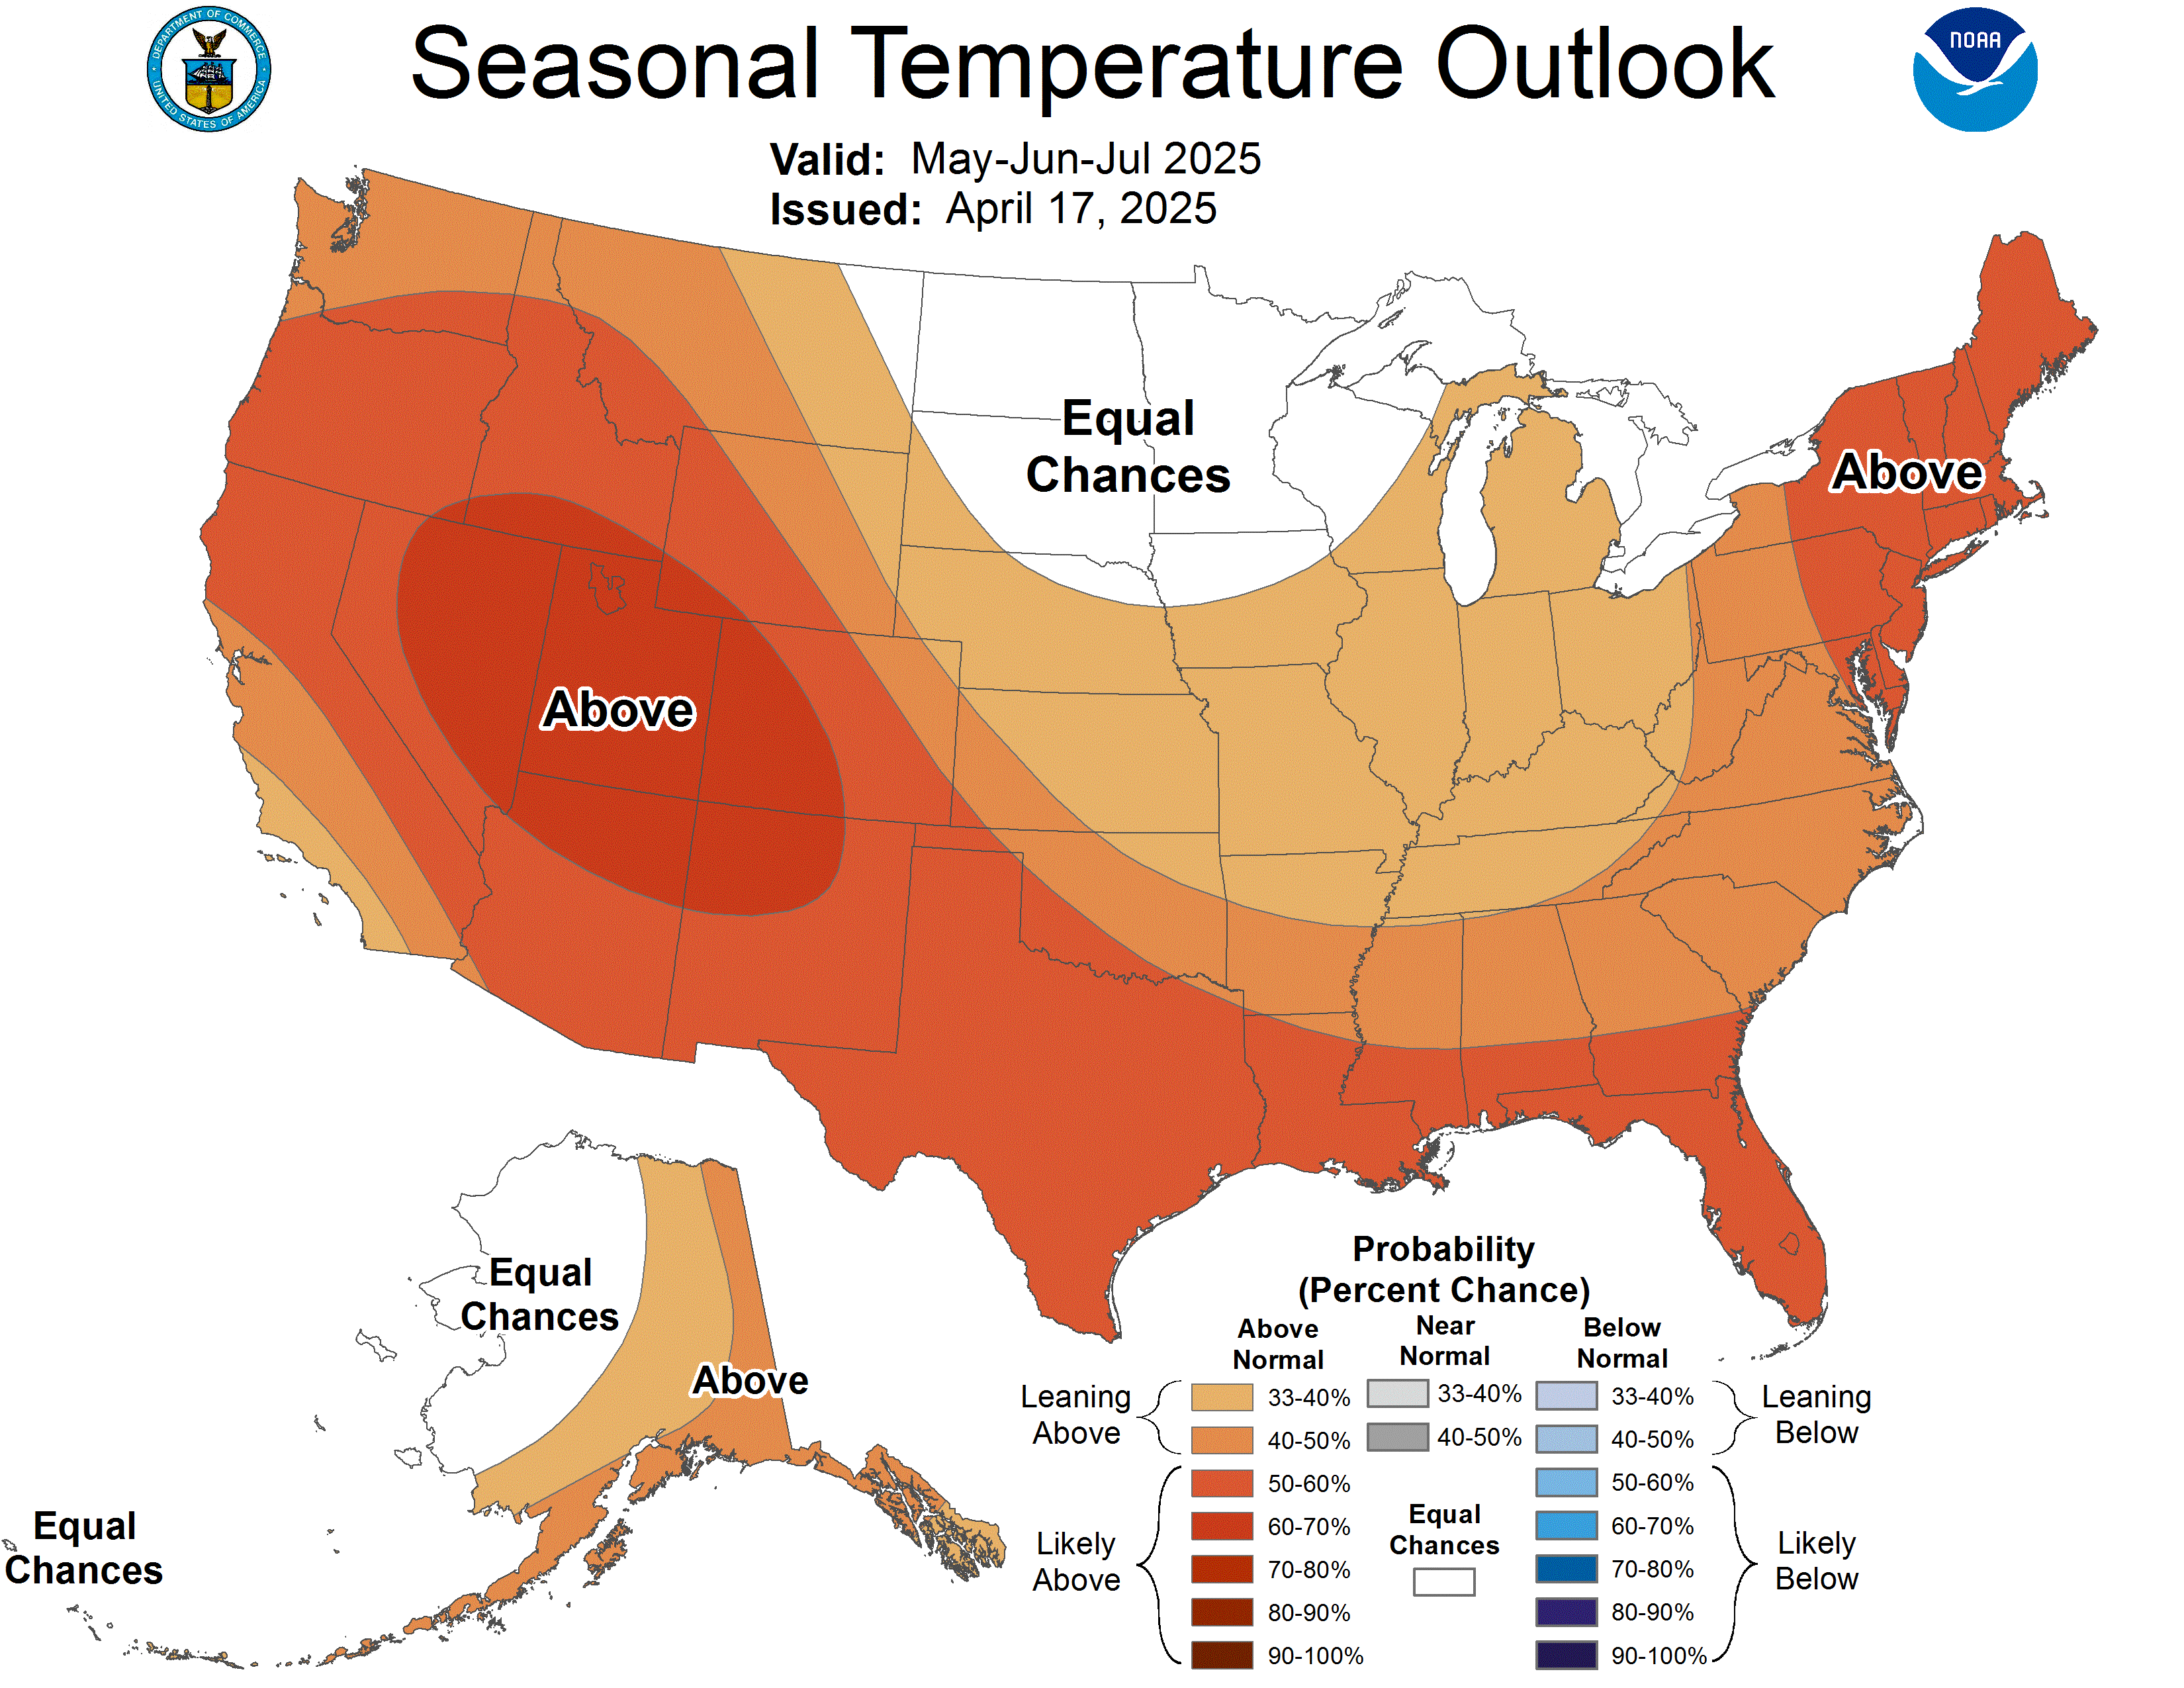
- Canadian national seasonal outlook issued -- Forecasters with Environment Canada issued their outlooks for temperature and precipitation across Canada for the three months of April March through June 2013, which represents the last two months of meteorological spring and the start of meteorological summer. The temperature outlook indicates that eastern Canada, and the southern Prairie Provinces along with most of British Columbia would experience above normal (1981-2010) spring and early summer temperatures. Only a small area of Canada along the southwestern shore of Hudson Bay would have below average temperatures for the next three months. Elsewhere across Canada, near normal spring temperatures were anticipated.
The Canadian precipitation outlook for April through June 2013 indicates that sections of southern Canada extending from British Columbia eastward to the Great Lakes could experience below average precipitation. On the other hand, sections of eastern Canada from northern Hudson Bay eastward to northern Labrador could have above normal precipitation.
[Note for comparisons and continuity with the three-month seasonal outlooks of temperature and precipitation generated for the continental United States and Alaska by NOAA's Climate Prediction Center, one would need to use Environment Canada's probabilistic forecasts for temperature and precipitation.]
CLIMATE
IMPACTS ON THE BIOSPHERE
- Warming in urban areas drives abundance of insect pests on street trees -- In research conducted in the Raleigh, NC metropolitan area, scientists from North Carolina State University and the University of Maryland have found that increased urban temperatures appear to play a significant role in the abundance of a common insect pest that is found on willow trees in the hottest part of the city. The researchers warn that projected warming in the next 50 years would cause an increased abundance in pests even in natural forests. [PLoS ONE]
PALEOCLIMATE
RECONSTRUCTION
- Ancient asteroid caused global firestorm on Earth leading to mass extinction -- Scientists at the University of Colorado, NOAA and other research institutions have found new evidence that shows the collision of a large asteroid with Earth nearly 66 million years ago caused a global firestorm that would have led to extinction of 80 percent of all Earth's species. The researcher's models indicate the collision would have ejected materials into the atmosphere that would have eventually returned to earth with temperatures reaching 2700 degrees Fahrenheit, thereby incinerating most of the planet's organic material. This discovery explains why little charcoal found has been found at the Cretaceous-Paleogene, or K-Pg, boundary when the asteroid struck Earth. [University of Colorado, Boulder]
CLIMATE AND
SOCIETY
- "National Fish, Wildlife, and Plants Climate Adaptation Strategy" unveiled to help safeguard nation's natural resources -- During the last week, the Obama Administration released a plan called "National Fish, Wildlife, and Plants Climate Adaptation Strategy" that represents the first nationwide strategy designed to help public and private decision makers address the impacts that climate change are having on natural resources and upon the public and economic ventures that depend on them. This document was developed by the US Department of Interior's U.S. Fish and Wildlife Service, the Department of Commerce's National Oceanic and Atmospheric Administration, and the New York State Department of Environmental Conservation in response to a request by Congress. Seven key steps were identified to help safeguard the nation's fish, wildlife and plants in a changing climate. [NOAA News]
- Majority of public supports stronger coastal development codes -- A new survey commissioned by Stanford University's Woods Institute for the Environment and the Center for Ocean Solution has found that a majority of Americans (62 percent) expressed support for stronger coastal development codes designed to minimize the impact of future extreme weather disasters with storms similar to Superstorm Sandy and rising sea levels. A majority of those surveyed also wanted the people whose properties and businesses located in hazard areas to foot the bill for this preparation, not the government. A significant majority of the survey's respondents (82 percent) believe that Earth's temperature has been rising during the last century. [Stanford News Service]
- Nation's cold cities are more energy demanding than warm cities -- A scientist at the University of Michigan has determined that those cities in the colder climates of the United States require more energy for sustainability than those cities in warmer climates. He determined that the Minneapolis, MN metropolitan area required three and a half times more energy than Miami, FL. He based his analysis on the number of heating or cooling degree days in each area; the efficiencies of heating and cooling appliances; and the efficiencies of power-generating plants. [University of Michigan News]
- New wetland restoration system could reduce massive floods and aid crops -- A team of engineers from Oregon State University, Indiana University-Purdue University in Indianapolis, the Wetlands Institute in New Jersey, and the U.S. Environmental Protection Agency have developed a new interactive planning tool designed to create networks of small wetlands in farmlands across the Midwest based upon location and size. This system that uses engineering principles to optimize the effectiveness of land use changes could help the region prevent massive spring floods, retain water and mitigate droughts in a warming climate. [Oregon State University]
- Website for human dimensions of climate change
-- An interagency effort within the US federal government
that
included NOAA, the Bureau of Land Management and the US Forest Service,
has resulted in a website called HD.gov (for HumanDimensions.gov) that
provides users, such as natural resource managers, with information on
the human dimensions on a variety of topics of interest such as climate
change. [HD.gov]
- Earthweek --
Diary of the Planet [earthweek.com]
Requires Adobe Acrobat Reader.

Concept of the Week: Developing a Quality
Long-term Instrumental Climate Record
Systematic temperature and precipitation observations have
been made at various locations across the nation for nearly two
centuries. While only a handful of stations were available in the early
19th century, weather and climate observations currently are made from
several hundred automatic weather sites operated by the National
Weather Service and the Federal Aviation Administration as well as
approximately 8000 stations in the Cooperative Observers Network
administered by the National Weather Service. The weather data from
these networks are also used to quantitatively assess changes of
climate during the instrumental period of the past as well into the
future. However, a variety of factors can affect the homogeneity of the
record. For example, the locations of many of the stations have moved,
from original downtown building roofs to current locations at airports.
And the physical surroundings of the stations have changed, many
becoming more urbanized.
In the late 1980s, the National Climatic Data Center (NCDC) in
conjunction with the US Department of Energy's Oak Ridge National
Laboratory created the United States Historical Climatology Network
(USHCN) of 1218 stations across the 48 coterminous states having
long-term records of both daily temperature and precipitation. This
network was designed to provide an essential baseline data set for
monitoring the nation's climate commencing in the late 19th century.
These stations were created from a subset of the Cooperative Observers
Network, chosen based upon long-term data quality that included length
of record, percent of missing data, spatial distribution and number of
station changes. Many of the selected USHCN stations were rural in an
attempt to reduce the influence of urbanization. Using statistical
analyses, data for these stations have been adjusted to account for
movement of stations, or when a different thermometer type was
installed. An urban warming correction was applied based upon
population of the surrounding area.
More recently, NOAA began the US Climate Reference Network
(USCRN), a project designed to collect and analyze climate data of the
highest possible quality for the next 50 to 100 years. Each USCRN
station would have electronic sensors that would make routine
measurements of air temperature, precipitation, IR ground surface
temperature, solar radiation and wind speed with a frequency of every
five minutes and transmit these data to both NCDC and to National
Weather Service offices via orbiting satellites on nearly a real-time
basis. In addition to these measurements, additional sensors could be
added to the USCRN stations that would measure soil temperature and
soil moisture. Conscientious and detailed site selection was made for
all stations so that they would not only be spatially representative,
but that they would be in locations where the surrounding physical
conditions would have a high likelihood of remaining the same over the
next 50 to 100 years. Many of the sites were placed on federal or state
owned lands, helping minimize the contamination of the climate record
by urbanization or other changes in local ground cover.
These long-term, comparative, spatially representative values
are vital to detect and verify the subtle changes in climatic
conditions before they become overwhelmingly obvious.
Concept of the Week: Questions
(Place your responses on the Chapter Progress Response Form
provided in the Study Guide.)
- The majority of United States Historical Climatology
Network (USHCN) stations were in [(rural),
(urban)] settings.
- The instruments in the US Climate Reference Network (USCRN)
sample the atmosphere as frequently as [(5
minutes),(1 day),(1
month)].
Historical Events:
- 2 April 1970...The last snowstorm of the 1969-70 winter
season came to an end at Chicago, IL as 10 .7 inches of snow fell -- a
final contribution to the season's amount of 77 inches, which set a new
all-time snow season record for the city. (Intellicast)
- 2 April 1975...A severe storm over the northeastern US
began on this day and blasted the area for the next 3 days. Wind gusts
reached 87 mph at West Harpswell, ME and Boston, MA recorded its lowest
April pressure on record (28.68 inches). Tides along the coast ran 2 to
4 feet above normal and anywhere from 1 to 4 feet of snow fell from
western New York to northern Maine with the higher elevations receiving
the most. (Intellicast)
- 3 April 1955...Record snow fell across north-central
Wyoming and south-central Montana as Sheridan WY established a 24-hour
snowfall record with 26.7 inches. (The Weather Doctor)
- 3 April 1996...Marquette, MI recorded 12.6 inches of snow
on this day to raise its seasonal snowfall to 250.8 inches -- the
city's snowiest winter ever. The old record was 243.8 inches set back
in 1981-82. The snowfall for the month now stood at 43.4 inches -- the
snowiest April on record for the city as well. (Intellicast)
- 4 April 1933...Pigeon River Bridge, MN reported 28 inches
of snow, which established the state 24-hour snowfall record. (4th-5th)
(The Weather Channel)
- 4 April 1955...A severe 3-day spring snowstorm ended over
north central Wyoming and south central Montana. Sheridan, WY had near
blizzard conditions for 43 hours and recorded 22.7 inches of snow in 24
hours on the 3rd to set a new 24-hour snowfall
record. Billings, MT had a storm total of 42.3 inches, a new single
storm snowfall record. (Intellicast)
- 4 April 1973...Sandia Crest, NM reported a snow depth of 95
inches, a record for the state of New Mexico. (The Weather Channel)
- 5 April 1926...A reported 0.65 inches of rain fell in one
minute at Opid's Camp, CA (Intellicast)
- 5 April 1945 ...The temperature at Eagles Nest, NM plunged
to 36 degrees below zero to establish an April record for the
continental United States. (Sandra and TI Richard Sanders - 1987)
- 5 April 1989...Unseasonably hot weather prevailed in the
southwestern U.S. Afternoon highs of 100 degrees at Santa Maria, CA and
105 degrees in Downtown Los Angeles established records for the month
of April. (The National Weather Summary)
- 6 April 1886...Detroit, MI recorded its biggest snowfall in
24 hours when 25.4 inches fell. (Intellicast)
- 6 April 1989...Unseasonably hot weather prevailed in
California. Afternoon highs of 91 degrees in Downtown San Francisco, 93
degrees at San Jose, 98 degrees at San Diego, 103 degrees at Santa
Maria, 104 degrees at Riverside, and 106 degrees in Downtown Los
Angeles established records for the month of April. (The National
Weather Summary)
- 6 April 1990...The last measurable snowfall of the 1989-90
season occurred at Valdez, AK. This brought the season snowfall to a
whopping 560.2 inches, breaking the old record of 517 inches set back
in the 1928-29 season. (Intellicast)
Return to DataStreme
ECS website
Prepared by Edward J. Hopkins, Ph.D., email hopkins@meteor.wisc.edu
© Copyright, 2013, The American Meteorological Society.