WEEKLY CLIMATE NEWS
8-12 July 2013
DataStreme Earth Climate Systems will return for Fall 2013 with new Investigations files starting during Preview Week, Monday, 2 September 2013. All the current online website products will continue to be available throughout the summer break period.
ITEMS
OF INTEREST
- Celebrating the centennial of the world's highest recorded temperature -- The National Park Service and the National Weather Service at Las Vegas, NV will co-host a celebration this Wednesday, 10 July 2013, to commemorate the 100th anniversary of the measurement of the world-record high temperature at Greenland Ranch in California's Death Valley. The thermometer on the afternoon of 10 July 1913 registered 134 degrees F, which has now been deemed the world's record high temperature. The Centennial Celebration will be held at the Furnace Creek Visitor Center in Death Valley National Park and several prominent scientists will speak at the occasion. [Las Vegas, NV National Weather Service Forecast Office] Note: This webpage also has links to a discussion of the record, to the climate of Death Valley and to heat safety. EJH
- "Super Western Heat Wave" hits the Southwest -- A large dome of hot air over the Southwestern United States that was associated with a ridge of high pressure extending upward through the mid and upper troposphere brought record high temperatures to many locations during the last week of June 2013 and the first few days of July. Some stations reported monthly high temperature records, while other locations registered all-time record high temperatures. Las Vegas (McCarran Airport) had a temperature of 117 on 30 June, which tied an all-time record for the station. The temperature at Furnace Creek in California’s Death Valley reached 129 degrees Fahrenheit on 30 June, which not only set a new all-time high temperature record for June in Death Valley, but also tied the United States high temperature for June that had been set on 23 June 1902 at Volcano, a former town near the Salton Sea in southern California. Additional records for these stations and others in southern Nevada, southeastern California and western Arizona are also detailed. [Las Vegas, NV National Weather Service Forecast Office]
Two satellite images of Death Valley were made by two separate sensors onboard NASA’s Landsat 8 satellite on the same day as the air temperature in the instrument shelter rose to 129.2 degrees Fahrenheit at the Furnace Creek Visitor’s Center. One of the images was an infrared satellite image made from data collected by the Thermal Infrared Sensor, which shows the surface temperature distribution across the region. The other image was a natural color image made by the Operational Land Imager, showing the sparse vegetation in Death Valley and the surrounding mountains. [NASA Earth Observatory]
- Satellite detects high nitrogen dioxide levels from Arizona wildfires -- An image made over one week ago from the Ozone Monitoring Instrument (OMI) onboard NASA's Aura satellite showed high levels of nitrogen dioxide (NO2) over Arizona due to three large wildfires that were burning across the Grand Canyon State in late June. This gas is produced by combustion and the highest concentration levels appeared to have originated from the Yarnell Hill Fire that had been initiated by a lightning strike. [NASA]
CURRENT
CLIMATE STATUS
- Canadian weather and climate in 2012 -- Scientists at Environment Canada recently reported that preliminary data indicate the national average temperature for the calendar year 2012 was 1.9 Celsius degrees (2.7? Fahrenheit degrees) above the 1961-1990 average, making the past year the fifth warmest year on record since nationwide climate records began in 1948. For comparison, the warmest year on record across Canada was 2010 when the national annual temperature was 3.0 Celsius degrees above normal. Annual temperatures for 2012 across large sections of northern and eastern Canada were at least 2 Celsius degrees above normal. No areas of Canada had near normal annual temperatures. Nationwide precipitation across Canada during 2012 was slightly (one percent) above the long-term average, as the year was the 33rd wettest in the 65-year period of record. Northern sections of Canada, especially across the Canadian Archipelago, the Yukon and Northwest Territories and Nunavut, along with sections of Newfoundland and Labrador in eastern Canada had annual precipitation totals that were 20 percent below normal. Scattered areas across Manitoba and Saskatchewan in the Prairie Provinces and in northern Quebec had nearly 20 percent above average precipitation. [Environment Canada]
CURRENT
CLIMATE MONITORING
- A gallery of NASA's fleet of Earth Science satellites -- Last week, NASA released an artist's drawing of the fleet of 16 orbiting satellites that are monitoring planet Earth from space. This fleet includes the Tropical Rainfall Measuring Mission (TRMM), which is the oldest as it was launched in 1997, and Landsat 8, which was launched in 2013 and represents the newest spacecraft. Instruments onboard these spacecraft make a wide variety of Earth observations designed to monitor the planet's atmosphere, hydrosphere, cryosphere and geosphere, providing scientists with important information on weather and climate patterns. Editor's Note This satellite fleet does not include the GOES series of geosynchronous satellites and the NOAA series of polar orbiting satellites that were launched by NASA but are operated by NOAA primarily for weather surveillance. EJH [NASA Earth Observatory]
- Orientation of Space Station changed for solar science -- At the request of European scientists, the orientation of the International Space Station was changed to accommodate solar research. This change in the Space Station's orientation would lengthen the window of time available to observe a full rotation of the Sun from its solar observatory without interruption. [NASA Climate News]
- Long-running ocean satellite is decommissioned -- During the last week, the Jason-1 ocean altimetry satellite, a spacecraft jointly operated by NASA and France's Centre National d'Etudes Spatiales (CNES), was decommissioned following the loss of its last remaining transmitter. This satellite was launched in December 2001 and extended the more than 20-year climate data record of global ocean surface topography that commenced in 1992 with the NASA/CNES Topex/Poseidon satellite. The Ocean Surface Topography Mission/Jason-2, launched in 2008, is continuing this unbroken record of global mean sea level change, an important climate indicator. [NASA Jet Propulsion Laboratory]
- Tests run on new Global Precipitation Measurement satellite -- During the last month engineers at NASA's Goddard Space Flight Center in Greenbelt, MD successfully completed tests on the solar arrays that will power the new Global Precipitation Measurement (GPM) satellite and its two onboard sensors, the GPM Microwave Imager and the Dual-frequency Precipitation Radar. The GPM Core satellite, which is scheduled to be launched in February 2014, is a collaboration between NASA and the Japan Aerospace Exploration Agency designed to measure rain and snow worldwide every three hours. [NASA Goddard Space Flight Center]
- An All-Hazards
Monitor -- This Web portal provides the user information from NOAA on
current environmental events that may pose as hazards such as tropical
weather, fire weather, marine weather, severe weather, drought and
floods. [NOAAWatch]
PALEOCLIMATE RECONSTRUCTION
- El Niño was unusually active in late 20th century -- An international team of scientists including those from the University of Hawaii at Manoa have reconstructed past climate indicating ENSO (El Niño-Southern Oscillation) behavior from more than 2200 tree-ring chronologies since 1300 AD from both the tropics and mid-latitudes in both hemispheres. The scientists have found that ENSO conditions appeared to have been unusually active in the late 20th century compared to the previous seven centuries, implying that this climate phenomenon may be responding to ongoing increased global temperatures. [University of Hawaii at Manoa]
CLIMATE FORECASTS
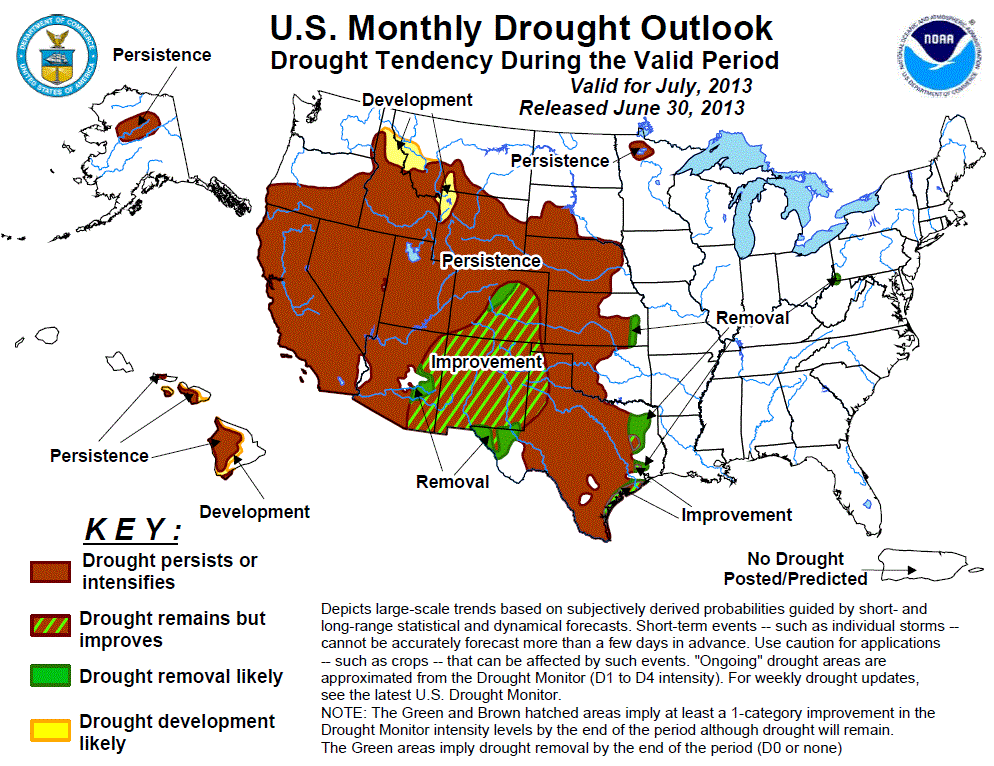
- New US Monthly Drought Outlook product unveiled -- In response to requests made by the public for shorter-term drought forecasts, NOAA's Climate Prediction Center (CPC) recently launched its "US Monthly Drought Outlook" that complements CPC's three-month "US Seasonal Drought Outlook." This new monthly drought outlook product should more accurately reflect rapidly developing drought conditions across the nation. Furthermore, changes have been made in the drought outlook categories for both the monthly and seasonal outlooks to increase clarification and understanding. [NOAA News]
The CPC US Monthly Drought Outlook for July 2013 that was issued early last week indicated that most areas of the West except for those states along the US-Canadian border should continue to expect drought conditions to persist. A few scattered areas across the southern Plains in Texas and the southern Rockies in Colorado and New Mexico could see some improvement. The Monthly Drought Outlook Discussion is available.
- Significant advances made in El Niño forecasting -- Researchers at Germany's Potsdam Institute for Climate Impact Research and the Justus-Liebig Universität Giessen have developed a new approach to forecasting upcoming El Niño events that employs advanced connectivity analysis using nearly six-decades of air temperature data collected from more than 200 measurement points in the Pacific. This method had outperformed existing methods. The forecast time was extended and the reliability was enhanced. [Potsdam Institute for Climate Impact Research]
CLIMATE IMPACTS ON THE BIOSPHERE
- Ocean food chain may be altered by greenhouse gas -- In a recent study conducted at the University of Southern California, researchers claim that increased atmospheric carbon dioxide levels not only result in a rise in global temperatures, but also control the biodiversity of organisms in the global oceans. The increased carbon dioxide may affect the base of the ocean's food chain by selectively weeding out certain strains of blue green algae or cyanobacteria that fix inert atmospheric nitrogen in biomass. [University of Southern California News]
CLIMATE AND SOCIETY
- Assessing hurricane-induced coastal change -- The US Geological Survey (USGS) released two studies early last week that assessed the probability of hurricane-induced coast change on the beaches of the Atlantic Seaboard from Florida northward to New York; one of the reports covers the coast south of North Carolina, while the other runs to the north from Virginia. These reports are designed to serve as "virtual toolkits" to help emergency managers and community planners along the coast. An online mapping tool is provided along with the reports; these items are available online. [USGS Newsroom]
- Climate impact hotspots identified -- An international team of researchers associated with the Intersectoral Impact Model Intercomparison Project recently reported that by the end of the 21st century, one out of ten people on Earth would likely to live in a climate impact hotspot, especially if greenhouse gas emissions continue unabated. In the worst case scenario, many more people would experience combined impacts on crop yields, water availability, ecosystems and health. The Amazon region of South America, the Mediterranean and East Africa were identified as regions that might experience severe change in multiple sectors. [Potsdam Institute for Climate Impact Research]
- Earthweek -- Diary of the Planet [earthweek.com] Requires Adobe Acrobat Reader.

Historical Events:
- 8 July 1936...The temperature hit an all-time record high of 106 degrees at the Central Park Observatory in New York City, a record that lasted until La Guardia Airport hit 107 degrees on 3 July 1966. (The Weather Channel)
- 8 July 1989...Sixteen cities in the central and western U.S. reported record high temperatures for the date. The high of 103 degrees at Denver, CO equaled their record for July, and a 110-degree reading at Rapid City, SD equaled their all-time record high. Denver reported a record five straight days of 100 degree heat, and Scottsbluff, NE reported a record eight days in a row of 100 degree weather. (The National Weather Summary)
- 8 July 2003...Dhahran, Saudi Arabia on the Persian Gulf, recorded a dewpoint of 95 degrees. (The Weather Doctor)
- 9 July 1914...Finland's hottest day on record occurred when the temperature at Turku, Finland reached 96.6 degrees. (The Weather Doctor)
- 9 July 1950...The town of York, NE was deluged with 13.15 inches of rain in 24 hours to establish a record for the Cornhusker State. (The Weather Channel)
- 9 July 1968...Columbus, MS received 15.68 inches of rain in 24 hours to establish a state record. (The Weather Channel)
- 9 July 1988...The percentage of total area in the country in the grips of severe to extreme drought reached 43 percent, the fourth highest total of record. The record of 61 percent occurred during the summer of 1934. (The National Weather Summary)
- 10 July 1913...The mercury hit 134 degrees at Greenland Ranch in Death Valley, CA, the highest temperature reading of record for the North American continent. Sandstorm conditions accompanied the heat. The high the previous day was 129 degrees, following a morning low of 93 degrees. (David Ludlum) (The Weather Channel)
- 10 July 1936...Afternoon high temperatures of 112 degrees at Martinsburg, WV, 109 degrees at Cumberland, MD and Frederick, MD, 110 degrees at Runyon, NJ, and 111 degrees at Phoenixville, PA, established all-time record highs for those four states, and marked the hottest day of record for the Middle Atlantic Coast Region. (The Weather Channel)
- 11 July 1888...The temperature at Bennett, CO reached 118 degrees, setting a record high temperature for the Centennial State. (NCDC)
- 11 July 1911...The highest temperature ever recorded in Maine was at North Bridgton, with a reading of 105 degrees. (NCDC)
- 11 July 1936...The temperature at St. Albans, Manitoba reached the provincial high temperature record of 112 degrees Fahrenheit, while the temperature at Atikokan, Ontario peaked at 108 degrees, tying the highest temperature ever in Ontario. (The Weather Doctor)
- 12 July 1900...The record high state temperature reading of 114 degrees in Wyoming was reached at Basin. This record has since been eclipsed in 1983 by a 115-degree reading. (Intellicast)
- 12 July 1910...Cherrapunji in India's northeastern Meghalaya State -- one of the rainiest places on Earth -- recorded 839 mm (33 inches) of rainfall on this day. (The Weather Doctor)
- 12-14 July 1936...The hottest three-day period in US history was recorded, with average temperatures of 88.5 degrees Fahrenheit; the second warmest such period had occurred three days earlier. (The Weather Doctor)
- 13 July 1975...Dover, DE was deluged with 8.50 inches of rain to establish a 24-hour maximum precipitation record for the state. (The Weather Channel)
- 13 July 1996...Heavy rains from the remnants of Hurricane Bertha caused roads to washout in the Camden, ME area. Two people were hurt when they drove into a 600-pound boulder that had fallen onto the roadway due to the heavy rain. (Accord's Weather Guide Calendar)
- 14 July 1886...Los Angeles, CA had its greatest 24-hour July rainfall with 0.24 inches. (Intellicast)
- 14-15 July 1911...Baguio, Luzon, Philippines reported 46 inches of rain, which represents Asia's greatest 24-hour rainfall: (The Weather Doctor).
Return to DataStreme
ECS website
Prepared by Edward J. Hopkins, Ph.D., email hopkins@meteor.wisc.edu
© Copyright, 2013, The American Meteorological Society.