WEEKLY CLIMATE NEWS
27-31 July 2015
DataStreme Earth Climate System will return for Fall 2015 with
new Investigations files starting during Preview Week, Monday, 24 August 2015. All the current online website products will continue to be available throughout the summer break period.
ITEMS
OF INTEREST
- Historic "EPIC" portrait of planet Earth obtained from afar -- NASA recently released an image that represents the first view of the entire sunlit side of Earth from one million miles away, obtained from NASA's Earth Polychromatic Imaging Camera (EPIC) mounted on the Deep Space Climate Observatory (DSCOVR) satellite. This DSCOVR spacecraft, launched in February 2015, is in orbit around Earth at the L1 Lagrange Point, which is located approximately one million miles from Earth at a point where the gravitational pull of the Sun and Earth cancel, providing a stable orbit and a continuous view of Earth. Goals of this mission include monitoring the solar wind and to measuring fluctuations in the Earth's albedo or reflectivity to solar radiation. The high-resolution multi-color image obtained from the EPIC instrument was produced by merging the data obtained from the solar radiation in the red, green and blue bands collected by the EPIC sensors. [NASA Earth Observatory]
- A celebration -- Saturday, 1 August 2015, is the ancient Celtic holiday of Lammas that corresponds to one of the cross quarter days, lying nearly halfway between the summer solstice (21 June 2015) and the autumnal equinox (23 September 2015). This holiday, also known as "loaf-mass day", originally marked the first wheat harvest of the year in the British Isles. [Editor's note: Next Friday, 7 August 2015, represents the exact halfway point between the dates of the solstice and equinox. EJH]
- In the Land of the Midnight Sun -- The sun will set at Barrow, AK early Sunday morning (2:09 AM AKDT on 2 August 2015), marking the first time in nearly 12 weeks (since 11 May 2015) that the sun has gone below the local horizon. However, the sun will remain below the horizon for 50 minutes before rising at 2:59 AM on Sunday. On each day until mid-November, the length of night will increase at Barrow. On the afternoon of 19 November 2015, the sun will set and remain below the horizon for a stretch of two months until late January 2016, when the sun will reappear above the horizon for slightly more than one hour.
CURRENT
CLIMATE STATUS
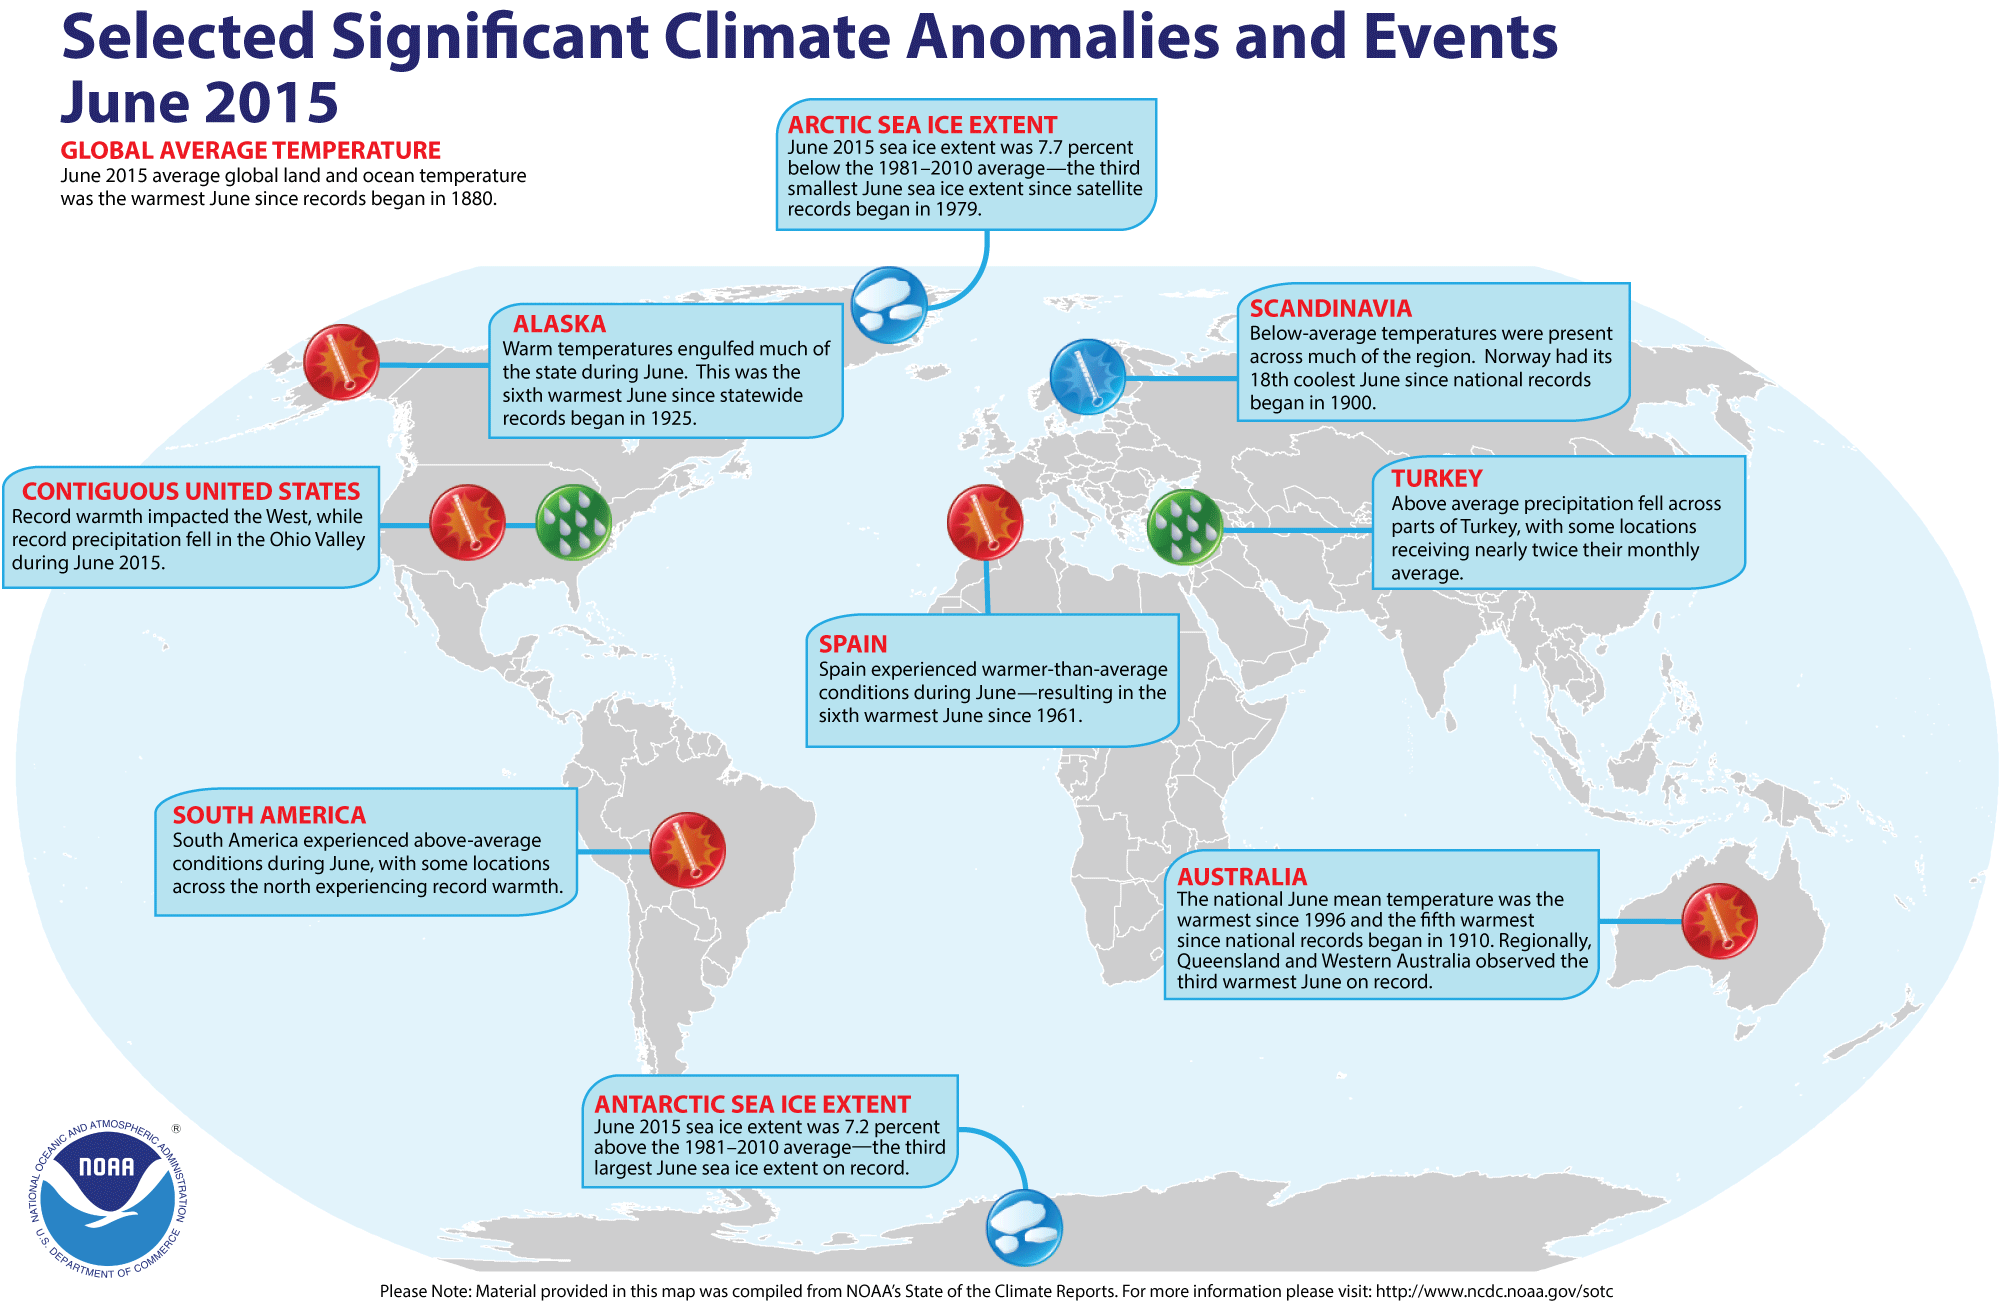
- Global temperature and ice cover for June 2015 reviewed -- Scientists at the NOAA National Centers for Environmental Information (NCEI, and formerly National Climatic Data Center)
recently reported on their analysis of preliminary weather data collected during the month of June 2015:
- The combined global land and ocean surface temperature for June
2015 was 1.58 Fahrenheit degrees above the 20th
century (1901-2000) average, which was the highest for any month of June since sufficiently detailed global climate records
began in 1880. When considered separately,
both the average land and average ocean temperatures for June 2015 were the highest for
any June. Furthermore, the average surface temperatures for land, ocean and combined land-ocean through the first six months of the year (January through June 2015) were the highest for the first half of any year on record.
- The researchers at the National Snow and Ice Data Center noted the areal extent of the Arctic sea ice
for June 2015 was
the third smallest since satellite surveillance began in 1979. On the
other hand, the extent of the Antarctic sea ice was the third largest
in the 37-year record. [NOAA/NCEI
State of the Climate]
- A global map of Selected Significant Climate Anomalies and Events for June 2015 is available from NCEI.
CURRENT
CLIMATE MONITORING
- Groundwater basins are being depleted globally -- Scientists from the University of California, Irvine, NASA's Jet Propulsion Laboratory, the National Center for Atmospheric Research, China's National Taiwan University, and the University of California, Santa Barbara recently reported that approximately one-third of the Earth's groundwater basins are being rapidly depleted by humans. The researchers based their findings from analysis of the annual changes in groundwater storage from 2003 to 2013 in 37 of the Earth's largest aquifers that were obtained from data collected by NASA's Gravity Recovery and Climate (GRACE) satellites. [NASA Earth Observatory]
- "SAM" Experiment led to 40 years of atmospheric discoveries -- The 40th anniversary of the Stratospheric Aerosol Measurements (SAM) experiment was recently observed as being the start of a program that has provided accurate measurements of the vertical structure of aerosols, ozone, water vapor and other important trace gases in the Earth's upper troposphere and stratosphere. The original SAM experiment, which was conducted aboard the Apollo spacecraft during the Apollo-Soyuz Test Project in July 1975, measured atmospheric aerosol concentrations using a technique called solar occultation. Instruments that measure atmospheric aerosols using the same technique were placed on subsequent satellite missions, including SAM II that flew on the Nimbus 7 satellite from 1978 to 1993, and second generation models SAGE (Stratospheric Aerosol and Gas Experiment) I aboard the Applications Explorer Mission-B (AEM-B) satellite between 1979 and 1982 and SAGE II aboard the Earth Radiation Budget Satellite (ERBS) from 1984 through 2005. SAGE III-Meteor-3M was a third generation, satellite-borne instrument that flew on the Russian Meteor-3M spacecraft from 2001 to 2006. SAGE III/ISS is scheduled to be placed on the International Space Station (ISS) in 2016. [NASA Langley Research Center]
- Greenland glaciers melting faster than anticipated -- Glaciologists from the University of California, Irvine and NASA's Jet Propulsion Laboratory claim that their mapping of Greenland glaciers reveals these glaciers melting at rates faster than previously thought. The glaciers are grounded deeper below sea level than previously measured, which would allow intruding ocean water to undercut the glacier faces and cause rapid melting and a rise in global sea level. [NASA Jet Propulsion Laboratory News]
CLIMATE FORCING
- Nighttime view of Indonesian volcanic plume from space -- Data collected from the Cloud-Aerosol Transport System (CATS) instrument mounted on the outside of the orbiting International Space Station (ISS) was used to produce an image of the plume of volcanic ash and other aerosols emanating from the Mount Raung, a stratovolcano on Indonesia's island of Java in mid-July. CATS is a lidar remote sensing instrument that makes profile measurements of atmospheric aerosols and clouds from the ISS. The vertical profile of the atmosphere that includes the volcanic ash plume from Mount Raung at a altitude of approximately five kilometers was obtained during a "nighttime" pass of ISS and CATS across Indonesia. A more traditional IR image of the plume and clouds was also provided from data collected by the Visible Infrared Imaging Radiometer Suite (VIIRS) on the NOAA/NASA Suomi NPP satellite. [NASA Earth Observatory]
- Satellite detects smoke from Arctic wildfires spreading Greenland Sea -- A true-color image made from data collected by the MODIS sensor onboard NASA's Aqua satellite in early July shows a veil of smoke that spread across the Greenland Sea, produced from the numerous wildfires that were burning across northern Canada and Alaska. This wildfire season appears to be heading for the worst in Alaska state history. [NASA Goddard Space Flight Center]
CLIMATE IMPACTS ON THE BIOSPHERE
- Less algae helps keep Lake Tahoe blue -- The Tahoe Environmental Research Center (TERC) of the University of California, Davis recently released its annual "Tahoe: State of the Lake Report 2015" that claims the iconic blueness of Lake Tahoe along the Nevada and California border is more strongly related to the lake's algal concentration than to its clarity. A TERC researcher created a quantitative "Blueness Index" of the lake's color from data collected by the NASA Jet Propulsion Laboratory's research buoy moored in the lake. [NASA Jet Propulsion Laboratory] and [University of California Davis Today]
- Ability of coral reefs to protect coasts appears to be reduced by climate change -- Researchers from the US Geological Survey (USGS) and the Dutch independent institute for applied research Deltares warn that pressures exerted by changes in climate and from direct human activity may be reducing the ability of coral reefs to protect tropical islands from a variety of coastal hazards including wave attach, erosion and salinization of potable water resources. The researchers used an open source wave model to investigate how the effects on water levels, waves and wave-driven run-up for several changes in certain reef properties.
[USGS Newsroom]
PALEOCLIMATE RECONSTRUCTIONS
- Abrupt climate change appears to have killed the mammoths -- An international team of scientists led by researchers from Australia's University of Adelaide and the University of New South Wales report that interstadials (or short, rapid warming events) during the last Pleistocene Ice Age (60,000-12,000 years ago) coincided with major extinction events of extinction events of large animals, such as the mammoths and giant sloths, as found in analysis of ancient DNA and radiocarbon dating. The scientists warn that the rapid changes in climate during these interstadials closely resemble the current rapid warming attributed to human activity. [University of Adelaide News]
- Abrupt climate change may have affected the "Cradle of Civilization" -- A team of international scientists from the US, France and Iran that was led by researchers from the University of Miami Rosenstiel School of Marine and Atmospheric Science claims that some of the earliest human civilizations in the Middle East and the Fertile Crescent in Asia may have been affected by abrupt climate change. Using sediment cores and other indicators, the scientists found that during the first half of the Holocene epoch, which began approximately 12,000 years, the Middle East most likely experienced wetter conditions in comparison with the last 6000 years, when the conditions across the region were drier and dustier. [University of Miami's Rosenstiel School of Marine and Atmospheric Science News]
CLIMATE AND SOCIETY
- Changing climate could be influencing visitation to US national parks -- Researchers with the National Park Service recently published a study that indicates that projected increases in temperature over the next several decades should attract more visitors to most of the national parks across the US. The researchers determined the relationships between historical long-term temperature averages and park visitation numbers, identified parks where visits were influenced by temperature, followed by an estimation of future park visitation for projected temperatures for both low and high greenhouse gas emissions. This climate-related increase in visitation could increase economic opportunities, while placing additional stress on park staff, facilities and resources. However, some parks located across the southern tier of states could experience a decrease in visitation. [NOAA Climate.gov News]
- Earthweek -- Diary of the Planet [earthweek.com] Requires Adobe Acrobat Reader.

Historical Events:
- 27 July 1897...Jewell, MD received 14.75 inches of rain, which was a 24-hour rainfall record for Maryland. (NCDC)
- 27 July 1939...The temperature at Lewiston, ID hit 117 degrees to establish an all-time record high for that location. (The Weather Channel)
- 27-28 July 1984...Unprecedented rainfall fell at Alvsbyn in Sweden (approximately 62 miles south of the Arctic Circle), which was remarkable for such a northern location that is at about the same latitude as Fort Yukon, AK. On the 26th, 5.51 inches fell and on the 27th, an additional 5.63 inches were recorded. (Accord's Weather Guide Calendar)
- 27 July 1989...Thunderstorms produced locally heavy rains in the southwestern U.S. Yuma, AZ experienced their most severe thunderstorm of record. Strong thunderstorm winds, with unofficial gusts as high as 95 mph, reduced visibility to near zero in blowing dust and sand. Yuma got nearly as much rain in one hour as is normally received in an entire year. The storm total of 2.55 inches of rain was a record 24-hour total for July. Property damage due to flash flooding and high winds was in the millions. (Storm Data)
- 28 July 1930...The temperature at Greensburg, KY soared to 114 degrees to set a state record. (The Weather Channel)
- 28 July 1934...The temperature at Orofino, ID climbed to 118 degrees to establish a record for Idaho. (The Weather Channel)
- 28 July 1995...Yuma, AZ reached its all-time high temperature reading with 124 degrees. (Intellicast)
- 29 July 1898...The temperature at Prineville, OR soared to 119 degrees to establish a state record, which was tied on the 10th of August of that same year at Pendleton. (The Weather Channel)
- 29 July 1930...Mississippi's record high temperature of 115 degrees was set at Holly Springs. (Intellicast)
- 30 July 1949...The state record temperature for Connecticut was established when the town of Greenville registered an afternoon high of 102 degrees. (The Weather Channel)
- 30 July 1965...The temperature at Portland, OR reached 107 degrees to equal their all-time record high. (The Weather Channel)
- 31 July 1861...Numerous world rainfall records were set at Cherrapunji, India as of this last day of July. These records include: 366.1 inches for a single 31-day month (during July 1861); 502.63 inches for two months (June-July 1861); 644.44 inches for three months (May-July 1861); 737.72 inches for four months (April-July 1861) and 1041.78 inches for 12 months (Aug. 1860-July 1861). (WMO, NWS)
- 31 July 1991...Roswell, NM closed out the month with a total of 6.68 inches of rain to set a new record for the month. (Intellicast)
- 31 July 1986...The temperature at Little Rock, AR soared to 112 degrees to establish an all-time record high for that location. Morrilton, AR hit 115 degrees, and daily highs for the month at that location averaged 102 degrees. (The Weather Channel)
- 1 August 1977...Excessive rains at Muduocaidang, China were responsible for establishing two world records, to include 33.07 inches in 6 hours and 55.12 inches in 10 hours. (WMO, NWS)
- 1 August 1985...A nearly stationary thunderstorm deluged Cheyenne, WY with rain and hail. Six inches of rain fell in six hours producing the most damaging flash flood of record for the state; a 24-hour precipitation record for the Cowboy State was also established with 6.06 inches. Two to five feet of hail covered the ground following the storm, which claimed twelve lives and caused 65 million dollars property damage. (Storm Data)
- 1 August 1993...San Francisco, CA hit 98 degrees, the hottest ever recorded for the city in August. (Intellicast)
Return to DataStreme
ECS website
Prepared by Edward J. Hopkins, Ph.D., email hopkins@meteor.wisc.edu
© Copyright, 2015, The American Meteorological Society.