Weekly Ocean News
WEEK ONE: 25-29
January 2016
Items of Interest:
- Uncommon alignment of five planets appears in the morning skies -- During the next month, sky watchers should be able to view five planets (Mercury, Venus, Saturn, Mars and Jupiter) in the predawn skies, if weather conditions are favorable. The simultaneous appearance of the five visible planets in the night sky is not common, as the last occurrence was in January 2005, while the next viewing opportunity should be in the evening sky in beginning in late July. A sky map is available to assist viewing. [NASA Jet Propulsion Laboratory News]
- An El Niño and La Niña FAQ site posted -- Since many recent unusual weather and climate events have been attributed to the ongoing strong El Niño event, the staff of NOAA Climate.gov has posted a feature that provides answers to the frequently asked questions (FAQ) concerning El Niño and its counterpart, La Niña. [NOAA Climate.gov News]
- Ocean charts, units, location and time -- Please
read this week's Supplemental
Information...In Greater Depth for a description of a several
types of oceanographic charts along with the definitions of some units
commonly used in ocean science to locate positions on the Earth's
surface and to identify time.
Ocean in the News:
- Eye on the tropics -- During the last
week, organized tropical cyclones (low pressure systems such as tropical
storms and hurricanes that form over tropical oceans) were
limited to two of the ocean basins of the Southern Hemisphere, which is currently in midsummer:
- In the South Pacific basin, Tropical Cyclone Victor continued traveling southward across the waters to the southeast of Pago Pago, American Samoa at the start of the week before curving toward the southwest and west-southwest. Victor had intensified briefly to become a category 2 tropical cyclone on the Saffir-Simpson Scale early last week. Continuing to the west-southwest during the second half of the week, Victor weakened to a tropical storm and then to a tropical depression before dissipating. approximately 500 miles to the east-southeast of Fiji. The NASA Hurricane Page has satellite images and additional information for Tropical Cyclone Victor.
- In the South Indian Ocean basin, a tropical storm formed late last week approximately 600 miles to the south of Diego Garcia that became Cyclone Corentin, a category 1 cyclone on the Saffir-Simpson Scale. Over this past weekend, Corentin moved southward and then to the southeast, as it began weakening. As of late Sunday (local time), Corentin had weakened to a tropical storm as it was approximately 1300 miles to the east-southeast of Port Louis, Mauritius. Additional information and satellite imagery for Cyclone Corentin are available from the NASA Hurricane Page.
- Current El Niño event could be approaching its peak -- One of the indicators of an El Niño event is the magnitude of the sea surface height anomalies over the equatorial Pacific Ocean, which represent the differences in the observed height of sea level over these sections of the Pacific and the long-term averages. A sequence of 13 images of the sea surface height anomalies across the Pacific Ocean basin obtained was made from altimetry data collected from NASA's Jason-2 spacecraft for the period beginning in mid January 2015 and running through January 2016. [NASA Earth Observatory]
- Jason-3 satellite successfully launched to monitor global sea level changes and storm intensities -- At the start of last week, NOAA and NASA jointly announced the successful launching of a joint USA-European satellite mission called Jason-3 from California's Vandenberg Air Force Base that will have sensors that will make highly detailed measurements of sea-level on Earth in order to gain insight into ocean circulation and climate change. In addition, the instruments should help forecast tropical cyclones as they form and travel over the tropical ocean basins. Jason-3 was placed into an orbit approximately 830 miles above the Earth's surface and will monitor approximately 95 percent of the ice-free oceans. The spacecraft will undergo a six-month phase to test the satellite's instruments in orbit before officially joining Jason-2, which was launched in 2008. [NOAA News] A 30-second video of the launch of Jason-3 is available. [NASA Jet Propulsion Laboratory News]
- Amount of heat accumulating in oceans doubles in recent decades -- A team of scientists from NOAA, the US Department of Energy's Lawrence Livermore National Laboratory and several universities recently reported that they have determined that approximately one-half of the increase in global ocean heat content since 1865 has occurred during the last two decades. The researchers also note that about one third of the ocean heat content increase has been in the deeper ocean. They based their conclusions on their analysis of ocean temperature observations ranging from those obtained from the historic H.M.S. Challenger 1872-1876 expedition to the modern ARGO robotic profiling floats and upon a large suite of climate models. [NOAA Office of Oceanic & Atmospheric Research News]
- New assessment made of the ecosystem health for California's Monterey Bay National Marine Sanctuary -- During the last week NOAA released the "Monterey Bay National Marine Sanctuary Condition Report" that describes the state of the resources and pressures that affect the Monterey Bay National Marine Sanctuary, the nation's second largest marine sanctuary that lies in the waters of the Pacific Ocean off the coast of central California. [NOAA National Marine Sanctuary News]
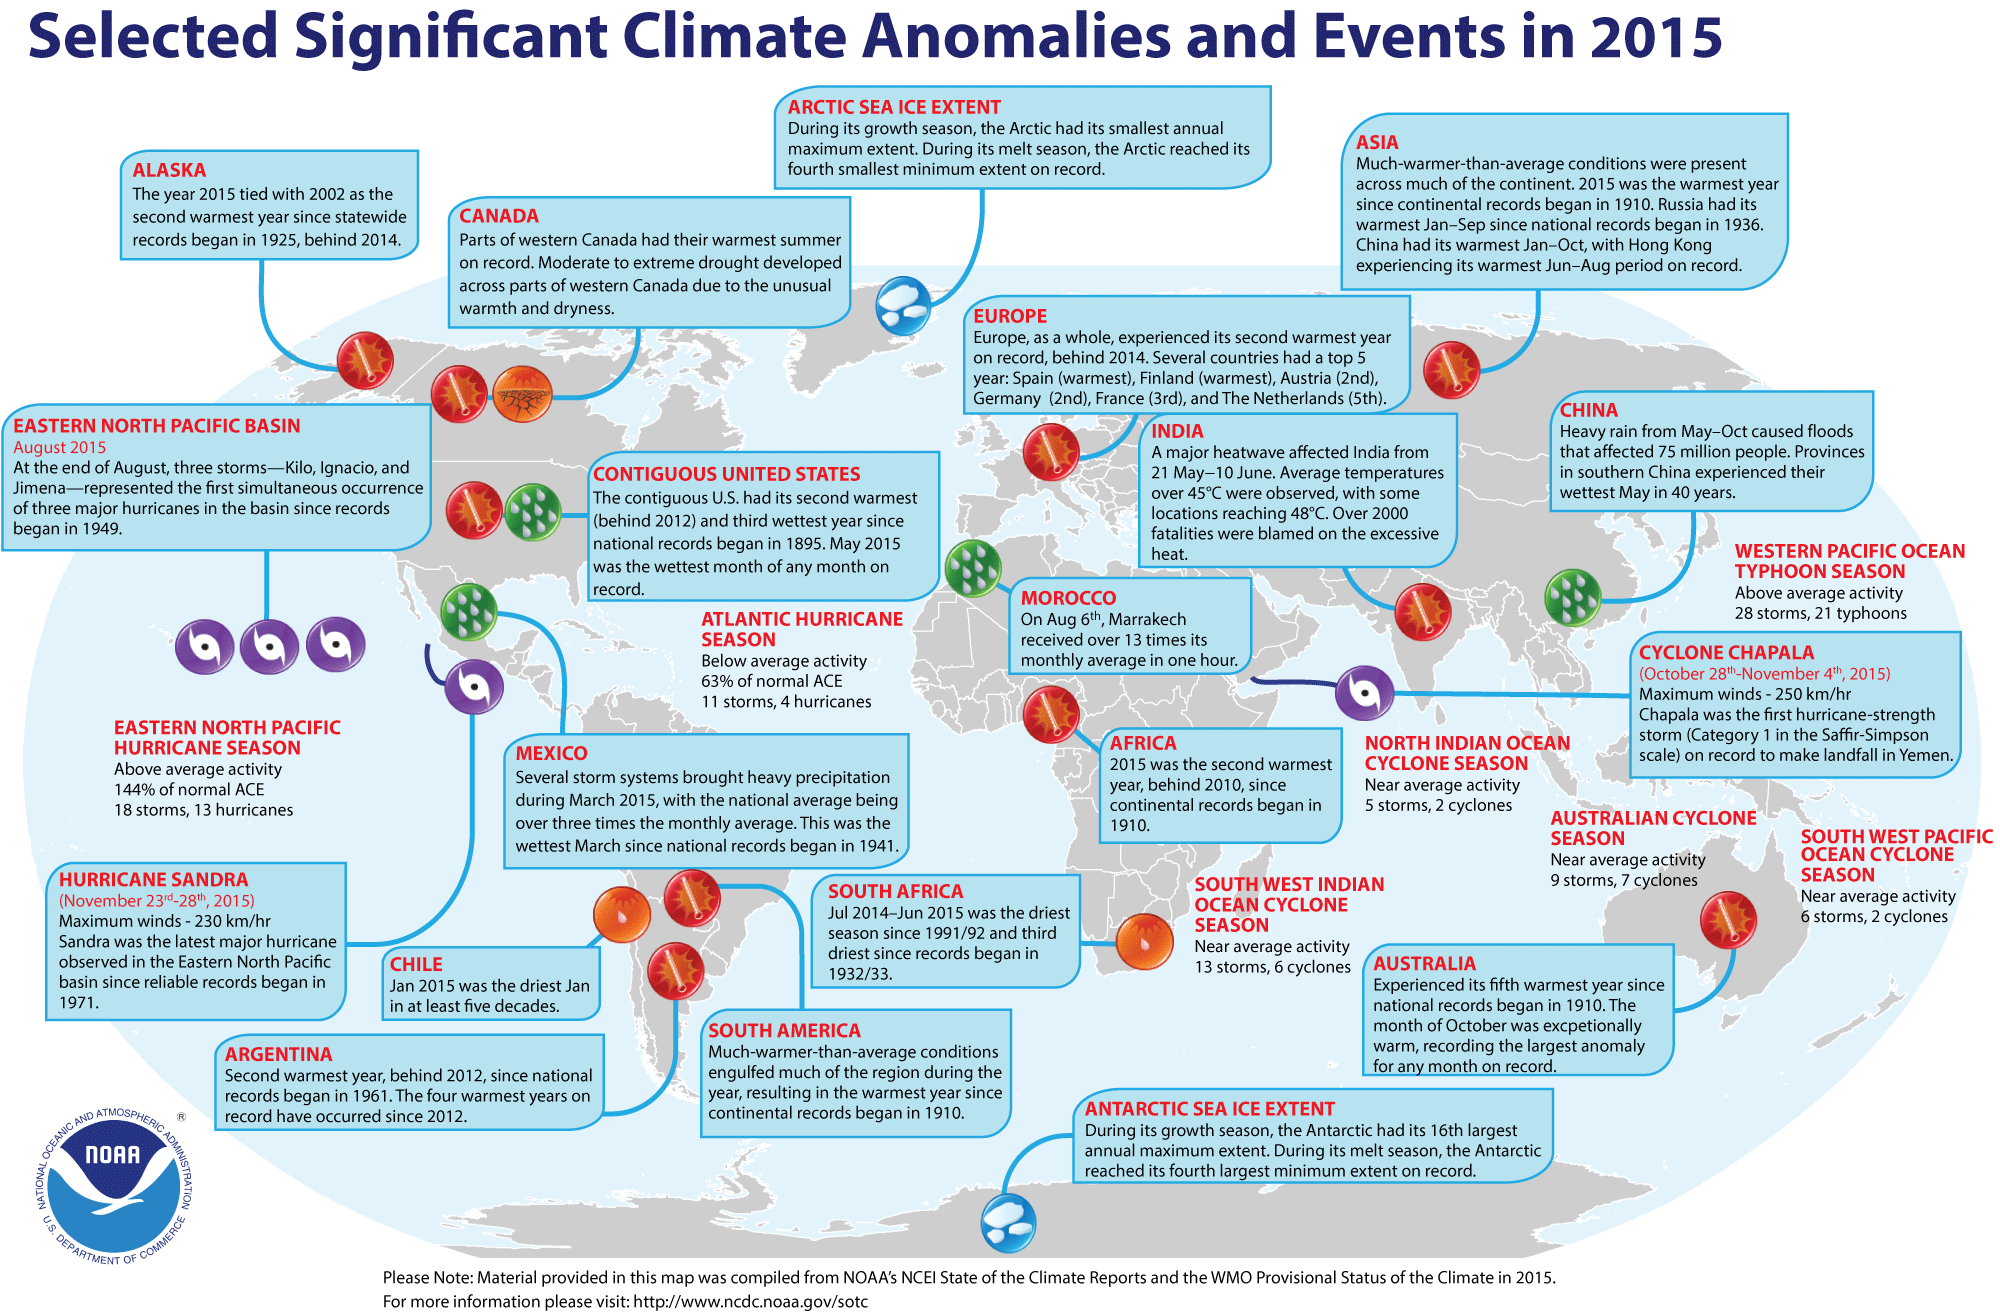
- Global weather and climate for 2015 reviewed -- Scientists at NOAA's National Centers for Environmental Information (NCEI) reported that
based upon their preliminary analysis of worldwide land and ocean
surface temperature data, the calendar year of 2015 was the warmest since sufficiently detailed world-wide climate records began in 1880. The average global temperature across land and ocean surface areas for 2015 was 1.62 Fahrenheit degrees above the 20th century (1901-2000) average of 57.0 degrees Fahrenheit), exceeding the previous record temperature departure set in 2014 by 0.29 Fahrenheit degrees. When considered separately, global land surface temperature for 2015 was 2.39 Fahrenheit degrees above the 20th century average, which surpassed the previous annual land records set in 2007 and 2010 by the largest margin (0.45 Fahrenheit degrees) on record . The annually-averaged temperature for ocean surfaces in 2015 was 1.33 Fahrenheit degrees higher than the 20th century average, which also set a record high departure.
The scientists
suggested that this past year's near-record strong El Niño event (an anomalous
atmospheric and oceanic circulation regime favoring warm or cool waters in the
equatorial Eastern Pacific Ocean) contributed to the record warmth of the near-surface waters of the global oceans.
Arctic sea ice remained well below the long-term averages that cover the period of record beginning in 1979 when satellite surveillance of the polar ice caps began. During the winter growth season, the sea ice covering the Arctic experienced its smallest annual maximum extent, while at the end of the summer melt season, the sea ice was the fourth smallest on record. Conversely,
sea ice around Antarctica was well above average. During the winter growth season, the ice around that content reached the 16th annual maximum extent for the satellite period, while during the summer melt season, the ice extent was the third largest minimum on record.
The scientists also note that the preliminary global precipitation data
from land-based stations indicate 2015 was slightly below (by 0.8 inches) long-term averages across the land areas. Although some areas of the planet were exceptionally wet, others
experienced extreme drought conditions. [NOAA/NCEI
State of the Climate]
NCEI also provides a map showing the Global Significant Weather and Climate Events map for 2015.
Using a slightly different methodology for averaging global surface
temperatures, scientists at NASA's Goddard Institute for Space Studies
(GISS) reported that the global average temperature for 2015 also was the
highest reading since 1880. [NASA
GISS]
An animated loop of 13 global temperature anomaly maps showing the spatial distribution of the differences between observed and normal temperatures recaps 2015, commencing with the 2015 annual average and then indexing through each month, running from January through December. A compressed (or zip) file containing the individual maps is available. [NOAA Climate.gov News]
NCEI also produced a summary of the global weather and climate for December 2015.
The December 2015 globally-averaged temperature across both land and ocean surfaces was 2.00 Fahrenheit degrees above the 20th century average, which represents the highest temperature departure for any month since 1880. [NOAA/NCEI
State of the Climate]
- A view of 136-year history of global temperatures in 30 seconds -- A 30-second animation of the variations in the global distribution of annual surface temperatures over both ocean and land beginning in 1880 and continuing through 2015 has been produced from world-wide climate data collected and analyzed at the NOAA National Climatic Data Center. Attention is turned to the increases in global temperature over the last four decades, culminating in the highest annual global temperature in 2015. [NOAA Environmental Visualization Laboratory]
- More powerful "superstorms" could be produced by warmer oceans -- Scientists at the University of Maryland's Earth System Science Interdisciplinary Center and at NASA Goddard Space Flight Center report that their simulations of weather patterns using a computer model indicate that a warmer Atlantic Ocean could substantially boost the destructive power of a future "superstorm" such as Sandy. The researchers simulated the weather patterns that created Sandy, but with a warmer sea surface temperature that would be associated with twice the current concentration of atmospheric carbon dioxide. These simulated storms were as much as 160 percent more destructive than Sandy. [College of Computer, Mathematical, & Natural Sciences, University of Maryland News]
- Abrupt shift in global climate traced as Ice Age glaciers began to retreat -- Earth scientists at Columbia University's Lamont-Doherty Earth Observatory have been reconstructing the long-term movement of the Intertropical Convergence Zone (ITCZ), or the zone where the large scale atmospheric flow patterns from the Northern and Southern Hemisphere converge and form a band of rainshowers and thunderstorms that essentially encircle the globe along what is also referred to as the "thermal equator." The researchers tracked the position of the ITCZ over the last 150,000 years from isotopic analysis using the thorium-232 isotopes in ocean floor sediment cores collected from three equatorial Pacific Ocean locations near the Line Islands south of Hawaii. During this time, the ITCZ that had been to the north of the Equator moved rapidly south toward the Equator and then back to the north as glaciers in the Northern Hemisphere waxed and waned. [Lamont-Doherty Earth Observatory News]
- An All-Hazards Monitor -- This Web portal provides the user information from NOAA's National Weather Service, FAA and FEMA on
current environmental events that may pose as hazards such as tropical
weather, fire weather, marine weather, severe weather, drought and
floods. [NOAA/NWS Daily Briefing]
- Earthweek -- Diary of the Planet [earthweek.com]
REPORTS FROM THE FIELD --
A request: If you have some ocean-related
experience that you would like to share with other DataStreme Ocean
participants, please send them to the email address appearing at the
bottom of this document for possible inclusion in a News file. Thank
you. EJH
Concept of the Week: Touring the
DataStreme Ocean RealTime Ocean Portal Website
NOTE: This Concept for the Week is a repeat of that which
appeared in last week's Weekly Ocean News.
Welcome to DataStreme Ocean! You are embarking on a study of
the world ocean and the role of the ocean in the Earth system. This
unique teacher enhancement course focuses on the flow and
transformations of energy and water into and out of the ocean, the
internal properties and circulation of the ocean, interactions between
the ocean and the other components of the Earth system, and the
human/societal impacts on and responses to those interactions.
Throughout this learning experience, you will be using the RealTime Ocean Portal to access and interpret a variety of
environmental information, including recent observational data. The
objective of this initial Concept of the Week is to
explore features of the RealTime Ocean Portal website.
On Monday of each week of the course, we will post the current Weekly Ocean News that includes Ocean in
the News (a summary listing of recent events related to the
ocean), Concept of the Week (an in-depth analysis
of some topic related to the ocean in the Earth system), and Historical
Events (a list of past events such as tsunamis or specific
advances in the understanding of oceanography). When appropriate, a
feature called Supplemental Information-In Greater Depth will be provided on some topic related to the principal theme of the
week.
You will use the RealTime Ocean Portal to
access and download the weekly "Current Ocean Studies" that complement Investigations found in your Ocean
Studies Investigations Manual. These materials should be
available Monday morning. Click the appropriate links to download and
print these electronic Current Ocean Studies and answer forms as well
as your Chapter Progress and Investigations Response forms.
The body of the RealTime Ocean Portal provides
links to the Earth System, information on Physical & Chemical,
Geological, and Biological aspects of the ocean, Atmosphere/Ocean
Interaction, the Great Lakes, and extras-a glossary of terms, maps and
educational links. Following each section is a link to other sites that
examine the various subsystems of the Earth system. Let's take a quick
tour to become more familiar with the RealTime Ocean Portal.
Under Physical & Chemical, click
on Sea
Surface Temperatures. This image uses a color scale
to depict the global pattern of sea surface temperatures (SSTs) (in
degrees Celsius) averaged over a recent 7-day period and based on
measurements by infrared sensors onboard Earth-orbiting satellites.
(Depending on your browser, you may have to place your mouse cursor on
the slide bar to the right and scroll down to view the entire image.)
Compare SSTs in the Northern Hemisphere with those in the Southern
Hemisphere. Return to the RealTime Ocean Portal.
Under Geological, click on Current
Earthquake Activity. The USGS Current World
Seismicity page provides a global map of the locations of seismic
(earthquake) events color-coded for the past seven days. The size of
the squares represents the magnitude of recent earthquakes. Note how
earthquakes are concentrated along the margin of the Pacific Ocean.
Details of recent earthquakes can be found by clicking on their map
squares. Return to the RealTime Ocean Portal.
The ocean is home to a wide variety of habitats and organisms.
Under Biological, click on Ocean
"Color" (Productivity). This is
a satellite-derived (SeaWiFS) color-coded map of biological
productivity in the surface waters of the world ocean is averaged from
October 1978 to date. Orange and red indicates the highest
productivity, while dark blue and violet indicate the lowest
productivity. Note the vast areas of relatively low productivity over
the central regions of the subtropical ocean basins. Individual months
within this period may be chosen for viewing. Now return to the RealTime Ocean Portal.
Under Atmosphere/Ocean Interaction, click
on TRMM/GPM
Tropical Rainfall. The TRMM/GPM (Tropical
Rainfall Measuring Mission) page includes color-coded maps of
the Monthly Mean Rainrate (in mm per day) across the tropics for the
last 30 days ending on the present date. Changes in rainfall are linked
to large-scale shifts in the atmosphere/ocean circulation in the
tropics. Now return to the RealTime Ocean Portal.
Take a few minutes when you have time to browse the other data
and information sources available via the RealTime Ocean Portal. Return frequently to learn more about the many resources on
the ocean in the Earth system. Bon voyage!
Concept of the Week: Questions
- The latest global sea surface temperature map indicates
that SSTs are generally higher over the [(western)(eastern)] tropical Pacific Ocean.
- The USGS map of Current Earthquake Activity indicates that
earthquakes appear to be more common along the [(east)(west)] coast of North America.
Historical Events
-
26 January 1700...The Cascadia Earthquake (magnitude 9) took place off the coast of British Columbia, as evidenced by Japanese records. Landslides and a tsunami destroyed many Native American villages along the coasts of Washington, Oregon and British Columbia, including Vancouver Island. Japanese written history tells of a massive tsunami striking fishing villages the next day along the coast of Honshu, killing hundreds. (Wikipedia) (Today in Science History)
- 26 January 1983...The California coast was battered by a storm, which produced record high tides, thirty-two foot waves, and mudslides, causing millions of dollars in damage. The storm then moved east and dumped four feet of snow on Lake Tahoe. (22nd-29th) (The Weather Channel)
- 28 January 1946...Canada's greatest sailing ship, Bluenose,
foundered on a Haitian reef; all hands were saved. Her likeness remains
on the Canadian ten-cent coin. (Wikipedia)
- 28 January 1969...A series of storms that battered Southern
California from the 18th to the 28th led to $125 million damage in the Los Angeles Basin, along with
approximately 9 storm and traffic-related deaths in California. Twenty
feet of water covered Sherman Island, a region that contains more than
10,000 dike-protected agricultural acres, when a dike failed. (Accord's
Weather Guide Calendar)
- 28 January 1971...A waterspout swept into Hawaii's Kailua
Bay, then into the business and hotel district of Kailua-Kona,
destroying or severely damaging a number of buildings including 40
apartment units and collapsing a 6-story hotel under construction.
Amazingly, only four people were injured. (Accord's Weather Guide
Calendar)
- 29-30 January 1966...A hurricane that struck Samoa was
responsible for 50 deaths, destroyed more than one-third of the homes
and damaged the remainder. As many as 50,000 people were left homeless.
Swains Island was leveled by the hurricane. Winds gusted to 100 mph at
Pago Pago. (Accord's Weather Guide Calendar)
- 29 January 1983...A series of Pacific coast storms finally
came to an end. The storms, attributed in part to the anomalous
ocean-atmosphere phenomenon, "El Niño," produced ocean swells 15 to 20
feet high that ravaged the beaches of southern California. Much of the
damage was to homes of movie stars in the exclusive Malibu Colony. (The
Weather Channel)
- 30 January 1790...The Original, the first boat specialized
as a lifeboat to rescue people from stormy seas was tested on the River
Tyne. This 30-foot long self-righting craft went out to shipwrecks for
40 years, saving hundreds of lives. William Wouldhave and Lionel Lukin
both claimed to be the inventor of the first lifeboat. (Wikipedia)
(Today in Science History)
- 30 January 1997...Surf up to 12 feet, with sets to 15 feet,
pounded the north and west shores of Hawaii. A wave swept eight people
into the ocean at Keane Point on Maui. Four tourists who were taking
pictures of the waves drowned. (Accord's Weather Guide Calendar)
Return to DataStreme Ocean's RealTime Ocean Portal
Prepared by DS Ocean Central Staff and Edward J. Hopkins,
Ph.D.,
email hopkins@aos.wisc.edu
© Copyright, 2016, The American Meteorological Society.