WEEKLY WEATHER AND CLIMATE NEWS
23-27 January 2017
Items of Interest:
- Welcome weather science educators to the annual AMS meeting -- The 97th annual meeting of the American Meteorological Society (AMS) is being held this week (22 - 26 January) in Seattle, WA. The theme for this year's AMS meeting is "Observations Lead the Way," stressing the need for observations to obtain the information needed by meteorologists and those in allied disciplines. One of the numerous symposia and conferences that will be conducted at the meeting is the 26th Symposium on Education, where educators from kindergarten through university levels will be attending workshops or giving presentations on weather, ocean, climate and space science education issues.
- Becoming AWARE -- During this coming
week (23-27 January 2017), Florida has scheduled its Severe Weather Awareness Week. If you live in the Sunshine State, you should take time to become familiar with the various
public affairs announcements issued by your local National Weather
Service Office. Other states farther to the north will be observing
their Severe Weather Awareness weeks in the next ten weeks.
With the approach of the severe
weather season, officials with the National Weather Service are
encouraging science teachers throughout the country to take time to
relay various safety information concerning weather-related hazards to
their students. These teachers should contact the Warning Coordination
Meteorologist at their local National Weather Service Office. They can
locate that person on-line by going to
http://www.stormready.noaa.gov/contact.htm and clicking on
the outline of their state appearing on the map.
- Worldwide GLOBE at Night 2017 Campaign is underway -- The first in the series of GLOBE at Night citizen-science campaigns for 2017 will continue through Saturday, 28 January. GLOBE at Night is a worldwide, hands-on science and education program designed to encourage citizen-scientists worldwide to record the brightness of their night sky by matching the appearance of a constellation (Orion in both the Northern and Southern Hemispheres) with the seven magnitude/star charts of progressively fainter stars.
Activity guides are also available. The GLOBE at night program is intended to raise public awareness of the impact of light pollution.
The next series in the 2017 campaign is scheduled for 18-27 February 2017. [GLOBE at Night]
- Quantifying this winter's severity across the nation -- At the midpoint of the meteorological winter season (December, January and February), the Midwestern Regional Climate Center (MRCC) has been calculating and posting the Accumulated Winter Season Severity Index (AWSSI) for approximate 100
stations around the 48 contiguous United States and Alaska. The AWSSI was developed by a former
director of MRCC and a weather
forecaster at the National Weather Service Forecast Office in Omaha, NE as an objective index that uses commonly available weather data to
quantify and describe the relative severity of the winter season. Click on the stations displayed on the map to reveal the daily sequence of AWSSI values through the current date. [MRCC]
Weather and Climate News Items:
- Eye on the tropics --- The weather remained relatively quiet last week across the tropical and subtropical ocean basins in both the Northern and Southern Hemispheres. The only weather system of note was a tropical depression, or an area of low pressure with surface winds of less than 39 mph that had formed over the western North Pacific basin
during the previous week. Some thunderstorms were also a part of the tropical depression. Being the first tropical depression of 2017 in the western North Pacific, it was identified as Tropical Depression 1W (or TD 1W). Although TD 1W had weakened over the previous weekend after passing across the Philippines, it strengthened as it moved across the South China Sea toward the Vietnam coast at the start of last week. TD 1W finally dissipated after it made landfall to the south-southeast of Ho Chi Minh City, Vietnam early in the week. The NASA Hurricane Page has additional information and satellite imagery for TD 1W.
- Global weather and climate for 2016 reviewed -- Scientists at NOAA's National Centers for Environmental Information (NCEI) reported that
based upon their preliminary analysis of worldwide land and ocean
surface temperature data, the calendar year of 2016 was the warmest since sufficiently detailed world-wide climate records began in 1880. The average global temperature across land and ocean surface areas for 2016 was 1.69 Fahrenheit degrees above the 20th century (1901-2000) average of 57.0 degrees Fahrenheit, exceeding the previous record temperature departure set in 2015 by 0.07 Fahrenheit degrees. The scientists attributed the record global temperature to record warm oceans. When considered separately, annually-averaged temperature for ocean surfaces in 2016 was 1.35 Fahrenheit degrees higher than the 20th century average, which set a record high departure.
A near-record strong El Niño event (an anomalous
atmospheric and oceanic circulation regime favoring warm or cool waters in the
equatorial Eastern Pacific Ocean) commencing in late 2015 and continuing into 2016 contributed to the record warmth of the near-surface waters of the global oceans. The global land surface temperature for 2016 was 2.57 Fahrenheit degrees above the 20th century average,
which surpassed the previous annual land record set in 2015.
The
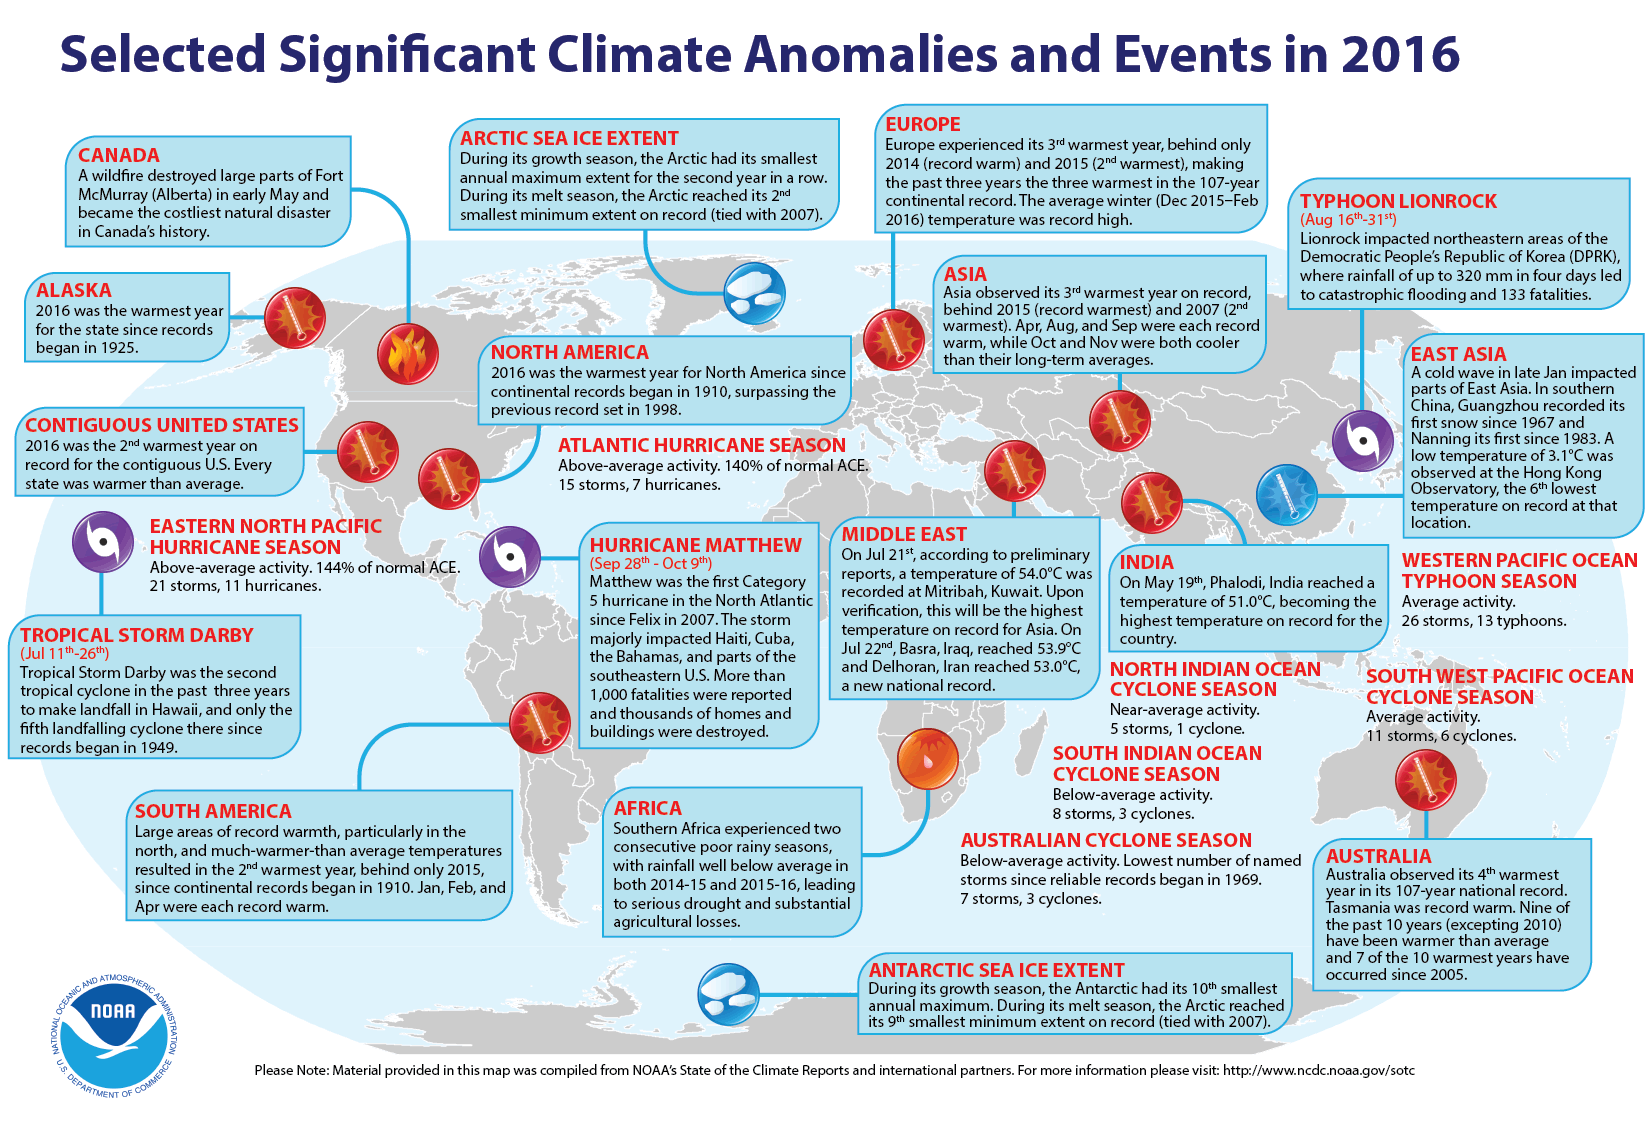
Arctic sea ice remained well below the long-term averages that cover the period of record beginning in 1979 when satellite surveillance of the polar ice caps began. During the winter growth season, the sea ice covering the Arctic experienced its smallest annual maximum extent, while at the end of the summer melt season, the sea ice tied 2007 for the second smallest minimum summer extent on record. Sea ice extent around Antarctica also was below average. During the winter growth season, the ice around that content reached the tenth smallest annual maximum extent for the satellite period, while during the summer melt season, the ice extent was the ninth smallest minimum on record.
The scientists also note that the preliminary global precipitation data
from land-based stations indicate 2016 a complex pattern, with many areas experiencing extreme drought because of below to much below average precipitation, while other land areas of the planet were exceptionally wet. [NOAA/NCEI
State of the Climate]
NCEI also provides a map showing the Global Significant Weather and Climate Events map for 2016.
Using data from essentially the same number of stations, but a slightly different methodology for averaging global surface
temperatures, scientists at NASA's Goddard Institute for Space Studies
(GISS) reported that the global average temperature for 2016 also was the
highest reading since 1880. [NASA
GISS] In a joint news conference held last Wednesday, the director of NASA GISS and the Chief of the Monitoring Branch of NCEI announced their findings that are summarized in graphical format on 14 slides. [NOAA/NASA Press Briefing]
A 15-second animated loop of global temperature anomaly maps showing the spatial distribution of the differences between observed and 20th century average temperatures was generated for each year from 1880 through 2016. An animation is also available in mp4 format. [NOAA Climate.gov News]
A blog was written
by a contractor for NCEI examining the statistical likelihood of the occurrence of a record high global temperature in three consecutive years or from 2014 through 2016.
[NOAA Climate.gov News]
NCEI also produced a summary of the global weather and climate for December 2016.
The December 2016 globally-averaged temperature across both land and ocean surfaces was 1.42 Fahrenheit degrees above the 20th century average, which represents the third highest temperature departure for the month since 1880, falling behind the December 2015 and December 2014 readings. The December 2016 surface temperature averaged across the global oceans was the fourth highest global ocean temperature on record, while the monthly temperature for the land surface ranked as the sixth highest December global land temperature. [NOAA/NCEI
State of the Climate]
- Satellite sees ash cloud develop over Alaskan volcano -- An image produced from data collected last week by the Moderate Resolution Imaging Spectroradiometer (MODIS) onboard NASA's Terra satellite reveals a plume of ash and condensate emanating from a partially submerged volcano on Bogoslof Island in Alaska's Aleutian Island chain. Some of the volcanic material was reported to have reached nearly 35,000 feet (10 km). [NASA Earth Observatory]
- Jason-3 satellite celebrates one year anniversary -- One year ago last week, the Jason-3 (for the third Joint Altimetry Satellite Oceanography Network) satellite was successfully launched into a low Earth orbit with an altitude of approximately 830 miles above the Earth's surface. Jason-3 satellite joins its predecessor Jason-2 in continuing to make ocean surface height measurements using onboard radar altimeters, which were first made from space by the TOPEX/Poseidon mission in 1992. In addition to monitoring sea surface height over time for assessing climate change, Jason-3 collects data on wave height and ocean winds. [NOAA NESDIS News]
- Satellites help rescue 307 people in 2016.-- During last year (2016), 307 people were rescued from life-threatening situations throughout the US and on its surrounding waters in part because of the role that NOAA's fleet of operational satellites played. Approximately two-thirds of those rescued (205) involved waterborne rescues. The 307 people that were rescued represent the largest annual total since the 357 rescued in 2007. By detecting distress signals from emergency beacons, these NOAA satellites helped pinpoint the location of these people and relay this information to first responders who perform the actual rescue. NOAA's geosynchronous and polar-orbiting satellites are part of the international COSPAS-SARSAT (COSPAS a Russian abbreviation for "Space System for the Search of Vessels in Distress" and SARSAT "Search and Rescue Satellite Aided Tracking") system. [NOAA NESDIS News]
- Global mild weather days pattern is shifting in response to changing climate -- Scientists from NOAA's Geophysical Fluid Dynamics Laboratory (GFDL) and Princeton University have made a global analysis of the frequency and location of the number of days considered to contain "mild weather," or weather conditions favorable to humans and to a variety of business. The mild weather days were defined as those having air temperatures that range between 64 and 86 degrees Fahrenheit, have less than one half inch of rain and have dew point temperatures (a measure of atmospheric water vapor content) below 68 degrees F, indicative of low humidity. According to this definition, the current global average is 74 mild days per year. Using high-resolution climate models, the researchers predict that by the end of the century, the global average of mild weather days will drop by 10 per year, or by 13 percent, due to increased global temperatures associated with fossil fuel burning by humans. The largest decreases in mild weather were expected to occur in tropical regions because of rising temperatures and humidity, with Africa, Asia and Latin America being hardest hit. However, some mid-latitude locations, especially parts of the US, Canada, northern Europe could gain a few more milder days. [NOAA News]
- Higher global temperatures could cause temporary increase in lake effect snows along Great Lakes -- A meteorologist with the National Oceanic and Atmospheric Administration (NOAA) Climate Prediction Center wrote feature article for the NOAA ClimateWatch Magazine explaining the apparent paradox that exists concerning an increase in lake effect snowfall along the downwind sides of the Great Lakes over recent decades even though global air temperatures have been increasing. Maps and satellite images showing the regions where lake effect snow are provided. [NOAA News]
- Patterns of tree mortality seen during extreme drought -- A team of researchers from the University of California Davis and the US Department of Agriculture's Forest Service have found that their aerial surveys of tree mortality show patterns of tree death during periods of extreme drought as ascertained from climate data. The aerial tree mortality surveys were conducted by between 2012 and 2015) during an extreme drought in California. The researchers found that trees in the driest, densest forests are most vulnerable to dying in extreme drought; the effects of extreme drought on forests can take years to surface; and high tree mortality rates are likely to continue as drought effects linger. [University of California Davis News]
- Geographic distribution of Lyme disease across nation appears related to temperature and humidity -- A US Geological Survey (USGS) research ecologist and colleagues at the University of Rhode Island and Michigan State University claim that the reason why Lyme disease is more prevalent in the Northeast, Mid-Atlantic and Upper Midwest, but less common crossways the South is associated with air temperature and humidity. The temperature and humidity appear to affect the behavior of disease-bearing ticks. The researchers studied the metabolism, life cycle and behavior of black-legged ticks, finding tick larvae live longer in relatively cool "northern" conditions. The northern ticks can be found on leaves and twigs above the leaf litter surface closer to human contact, while southern ticks remain below the litter surface farther away from humans. [USGS Newsroom]
- An All-Hazards Monitor -- This Web portal provides the user information from NOAA's National Weather Service, FAA and FEMA on
current environmental events that may pose as hazards such as tropical
weather, fire weather, marine weather, severe weather, drought and
floods. [NOAA/NWS Daily Briefing]
- Earthweek -- Diary of the Planet [earthweek.com]
Return to RealTime Weather Portal
Prepared by Edward J. Hopkins, Ph.D., email hopkins@aos.wisc.edu
© Copyright, 2017, The American Meteorological Society.