WEEKLY WEATHER AND CLIMATE NEWS
30 January - 3 February 2017
Items of Interest:
- Uncommon alignment of five planets appears in the morning skies -- During the next month, sky watchers should be able to view five planets (Mercury, Venus, Saturn, Mars and Jupiter) in the predawn skies, if weather conditions are favorable. The simultaneous appearance of the five visible planets in the night sky is not common, as the last occurrence was in January 2005, while the next viewing opportunity should be in the evening sky in beginning in late July. A sky map is available to assist viewing. [NASA Jet Propulsion Laboratory News]
- An El Niño and La Niña FAQ site posted -- Since many recent unusual weather and climate events have been attributed to the ongoing strong El Niño event, the staff of NOAA Climate.gov has posted a feature that provides answers to the frequently asked questions (FAQ) concerning El Niño and its counterpart, La Niña. [NOAA Climate.gov News]
Weather and Climate News Items:
- Eye on the tropics -- During the last
week, organized tropical cyclones (low pressure systems such as tropical
storms and hurricanes that form over tropical oceans) were
limited to two of the ocean basins of the Southern Hemisphere, which is currently in midsummer:
- In the South Pacific basin, Tropical Cyclone Victor continued traveling southward across the waters to the southeast of Pago Pago, American Samoa at the start of the week before curving toward the southwest and west-southwest. Victor had intensified briefly to become a category 2 tropical cyclone on the Saffir-Simpson Scale early last week. Continuing to the west-southwest during the second half of the week, Victor weakened to a tropical storm and then to a tropical depression before dissipating. approximately 500 miles to the east-southeast of Fiji. The NASA Hurricane Page has satellite images and additional information for Tropical Cyclone Victor.
- In the South Indian Ocean basin, a tropical storm formed late last week approximately 600 miles to the south of Diego Garcia that became Cyclone Corentin, a category 1 cyclone on the Saffir-Simpson Scale. Over this past weekend, Corentin moved southward and then to the southeast, as it began weakening. As of late Sunday (local time), Corentin had weakened to a tropical storm as it was approximately 1300 miles to the east-southeast of Port Louis, Mauritius. Additional information and satellite imagery for Cyclone Corentin are available from the NASA Hurricane Page.
- Views of the Middle Atlantic's Blizzard of 2016 seen from several satellites -- A sensors onboard a variety of NASA and NOAA satellites caught several impressive views of the major winter storm that brought record snowfall, blizzard conditions and coastal flooding from strong onshore winds to the Middle Atlantic States over this past weekend. Some of the images were nighttime and daytime images. from the polar orbiting NASA-NOAA Suomi NPP satellite and the geosynchronous NOAA GOES-East satellite. Precipitation estimates were obtained from the NASA Global Precipitation Measurement (GPM) core observatory. [NASA Goddard Space Flight Center]
A summary listing of the strong peak wind gusts, snowfall totals and ice accumulations from the "Historic Eastern US Major Winter Storm" is available. [National Weather Service Weather Prediction Center]
- Record snowstorms and a warming climate -- This past weekend's record snowstorm that slammed the Middle Atlantic States has caused some people to wonder if record snowstorms may be proof the global warming is not happening. A feature appearing on NOAA's Climate.gov site notes that "snowstorms remain quite possible, and natural climate patterns and random variability will still lead to winters that are unusually cold and snowy in different locations."[NOAA Climate.gov News]
- Global weather and climate for 2015 reviewed -- Scientists at NOAA's National Centers for Environmental Information (NCEI) reported that
based upon their preliminary analysis of worldwide land and ocean
surface temperature data, the calendar year of 2015 was the warmest since sufficiently detailed world-wide climate records began in 1880. The average global temperature across land and ocean surface areas for 2015 was 1.62 Fahrenheit degrees above the 20th century (1901-2000) average of 57.0 degrees Fahrenheit), exceeding the previous record temperature departure set in 2014 by 0.29 Fahrenheit degrees. When considered separately, global land surface temperature for 2015 was 2.39 Fahrenheit degrees above the 20th century average, which surpassed the previous annual land records set in 2007 and 2010 by the largest margin (0.45 Fahrenheit degrees) on record . The annually-averaged temperature for ocean surfaces in 2015 was 1.33 Fahrenheit degrees higher than the 20th century average, which also set a record high departure.
The scientists
suggested that this past year's near-record strong El Niño event (an anomalous
atmospheric and oceanic circulation regime favoring warm or cool waters in the
equatorial Eastern Pacific Ocean) contributed to the record warmth of the near-surface waters of the global oceans.
Arctic sea ice remained well below the long-term averages that cover the period of record beginning in 1979 when satellite surveillance of the polar ice caps began. During the winter growth season, the sea ice covering the Arctic experienced its smallest annual maximum extent, while at the end of the summer melt season, the sea ice was the fourth smallest on record. Conversely,
sea ice around Antarctica was well above average. During the winter growth season, the ice around that content reached the 16th annual maximum extent for the satellite period, while during the summer melt season, the ice extent was the third largest minimum on record.
The scientists also note that the preliminary global precipitation data
from land-based stations indicate 2015 was slightly below (by 0.8 inches) long-term averages across the land areas. Although some areas of the planet were exceptionally wet, others
experienced extreme drought conditions. [NOAA/NCEI
State of the Climate]
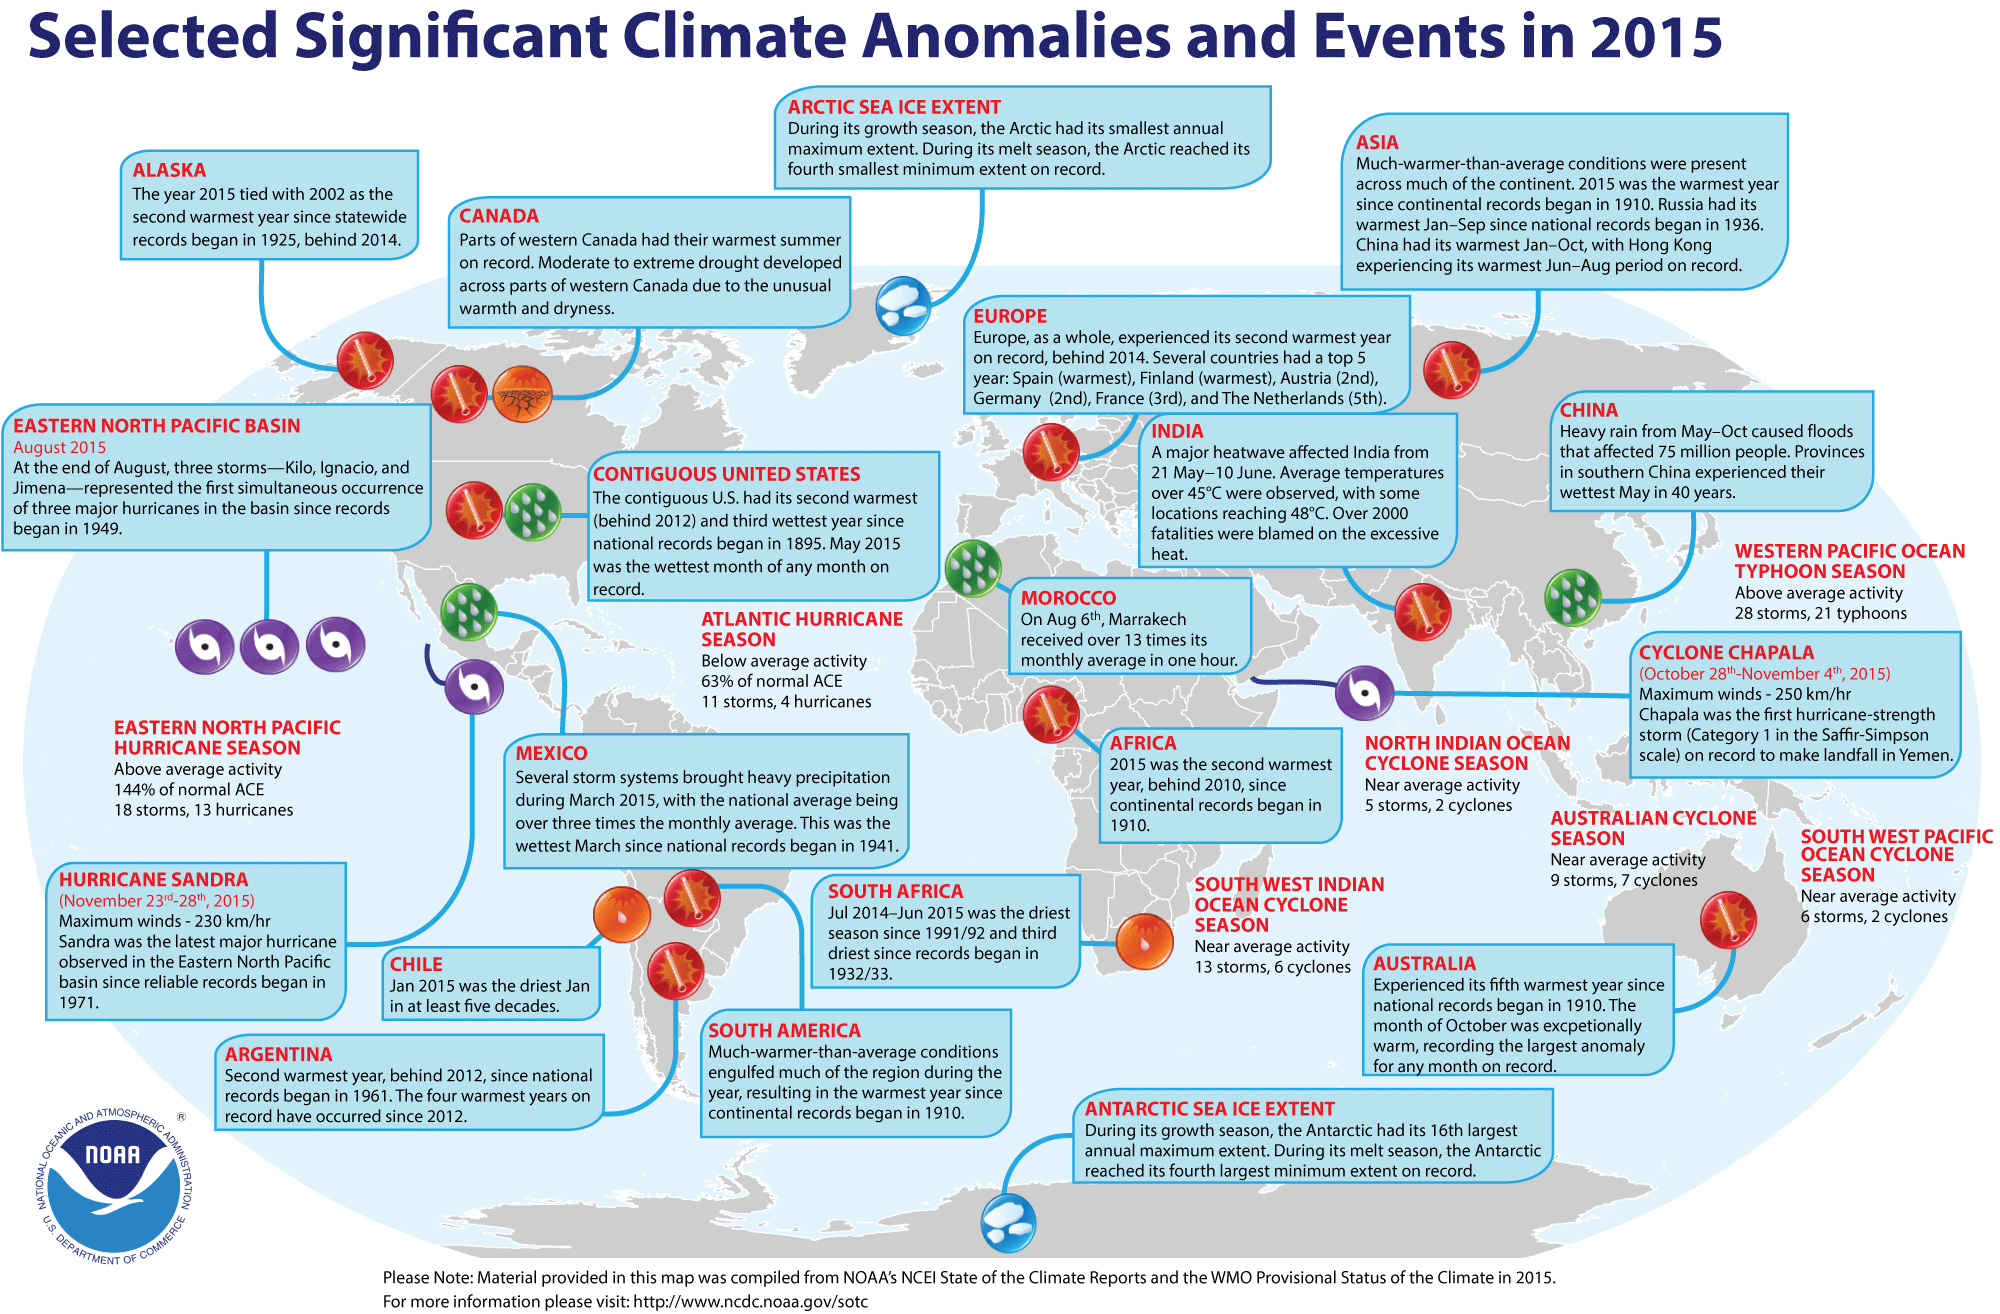
NCEI also provides a map showing the Global Significant Weather and Climate Events map for 2015.
Using a slightly different methodology for averaging global surface
temperatures, scientists at NASA's Goddard Institute for Space Studies
(GISS) reported that the global average temperature for 2015 also was the
highest reading since 1880. [NASA
GISS]
An animated loop of 13 global temperature anomaly maps showing the spatial distribution of the differences between observed and normal temperatures recaps 2015, commencing with the 2015 annual average and then indexing through each month, running from January through December. A compressed (or zip) file containing the individual maps is available. [NOAA Climate.gov News]
NCEI also produced a summary of the global weather and climate for December 2015.
The December 2015 globally-averaged temperature across both land and ocean surfaces was 2.00 Fahrenheit degrees above the 20th century average, which represents the highest temperature departure for any month since 1880. [NOAA/NCEI
State of the Climate]
- A view of 136-year history of global temperatures in 30 seconds -- A 30-second animation of the variations in the global distribution of annual surface temperatures over both ocean and land beginning in 1880 and continuing through 2015 has been produced from world-wide climate data collected and analyzed at the NOAA National Climatic Data Center. Attention is turned to the increases in global temperature over the last four decades, culminating in the highest annual global temperature in 2015. [NOAA Environmental Visualization Laboratory]
- Current El Niño event could be approaching its peak -- One of the indicators of an El Niño event is the magnitude of the sea surface height anomalies over the equatorial Pacific Ocean, which represent the differences in the observed height of sea level over these sections of the Pacific and the long-term averages. A sequence of 13 images of the sea surface height anomalies across the Pacific Ocean basin obtained was made from altimetry data collected from NASA's Jason-2 spacecraft for the period beginning in mid January 2015 and running through January 2016. [NASA Earth Observatory]
- Jason-3 satellite successfully launched to monitor global sea level changes and storm intensities -- At the start of last week, NOAA and NASA jointly announced the successful launching of a joint USA-European satellite mission called Jason-3 from California's Vandenberg Air Force Base that will have sensors that will make highly detailed measurements of sea-level on Earth in order to gain insight into ocean circulation and climate change. In addition, the instruments should help forecast tropical cyclones as they form and travel over the tropical ocean basins. Jason-3 was placed into an orbit approximately 830 miles above the Earth's surface and will monitor approximately 95 percent of the ice-free oceans. The spacecraft will undergo a six-month phase to test the satellite's instruments in orbit before officially joining Jason-2, which was launched in 2008. [NOAA News] A 30-second video of the launch of Jason-3 is available. [NASA Jet Propulsion Laboratory News]
- Balloon launched from Antarctica to study the Sun -- A helium-filled scientific balloon was launched from Antarctica's McMurdo station at the start of last week carrying the Gamma-Ray Imager/Polarimeter for Solar flares, or GRIPS, payload. This balloon, which was to reach an altitude of approximately 130,000 feet, is expected to be carried by the stratospheric winds circulating around the South Pole for at least two weeks, during which time the GRIPS instrument would be observing gamma rays, or extremely high-energy radiation released by solar flares emanating from the Sun.
[NASA Goddard Space Flight Center Feature]
- Amount of heat accumulating in oceans doubles in recent decades -- A team of scientists from NOAA, the US Department of Energy's Lawrence Livermore National Laboratory and several universities recently reported that they have determined that approximately one-half of the increase in global ocean heat content since 1865 has occurred during the last two decades. The researchers also note that about one third of the ocean heat content increase has been in the deeper ocean. They based their conclusions on their analysis of ocean temperature observations ranging from those obtained from the historic H.M.S. Challenger 1872-1876 expedition to the modern ARGO robotic profiling floats and upon a large suite of climate models. [NOAA Office of Oceanic & Atmospheric Research News]
- Seasonal weather outlook released -- Late last week,
forecasters at the NOAA Climate Prediction Center released their new national Seasonal
Outlook for the next three months of 2016 (February-April) that includes the last month of meteorological winter (December-February) and the first two months of meteorological spring (March-May). Specific details of their outlooks include:
- Temperature and precipitation outlooks -- According to their temperature outlook, the West Coast along with the northern tier of states extending from the Pacific Northwest to New England should experience a high chance of above average temperatures for these three upcoming months.
The greatest probability of such an occurrence is to be found across the Pacific Northwest and the Upper Midwest. Conversely, sections of the southern tier of states from the southern Rockies to the northern Florida were considered to have a better than average chance of below average late winter-early spring temperatures. Southern Texas would have the greatest chance of chilly weather. The outlook indicates that the remainder of the 48 contiguous states would have nearly equal chances of warmer or cooler than normal conditions.
Their precipitation outlook calls for sections of the Northwest, primarily across interior Washington and Idaho along with sections of the Midwest centered on the Great Lakes to have a better than even chance of below average precipitation for the upcoming three months of 2016.
Conversely, the Southwest and the Southeast were considered to be under a better than even chance of above average precipitation. Those areas in the Southwest extending from southern California eastward to west Texas and across the Florida Peninsula would have the best chance of wet weather. Elsewhere, a large area of the coterminous states should have essentially equal chances of below and above average precipitation for the end of winter and the first two months of meteorological spring.
A summary of the prognostic discussion of the 3-month outlook for non-technical users is available from CPC. These forecasts were based in part that assuming that the strong El Niño event should have peaked, with a transition to an ENSO-neutral situation possibly occurring by late spring or early summer of 2016 (in the Northern Hemisphere) when neither El Niño nor La Niña conditions would prevail. A description is also provided as how to read these 3-class, 3-month Outlook maps.
- Seasonal Drought Outlook -- The
forecasters at NOAA's Climate Prediction Center also released their US
Seasonal Drought Outlook last week that would run from mid-January through April 2016. Their outlook would call for persistence or the development of extensive drought conditions across the interior Northwest, primarily across eastern Washington, central and eastern Oregon, Idaho and western Montana. Sections of California, Nevada, southern Oregon and the northern Utah currently experiencing drought conditions could see continuation of drought conditions, with a few areas across the West seeing sufficient improvement that they would possibly be removed from drought status. Sections of southern New England also could see an end to drought conditions. Note: a Seasonal Drought Outlook Discussion is included describing the forecasters' confidence.
- More powerful "superstorms" could be produced by warmer oceans -- Scientists at the University of Maryland's Earth System Science Interdisciplinary Center and at NASA Goddard Space Flight Center report that their simulations of weather patterns using a computer model indicate that a warmer Atlantic Ocean could substantially boost the destructive power of a future "superstorm" such as Sandy. The researchers simulated the weather patterns that created Sandy, but with a warmer sea surface temperature that would be associated with twice the current concentration of atmospheric carbon dioxide. These simulated storms were as much as 160 percent more destructive than Sandy. [College of Computer, Mathematical, & Natural Sciences, University of Maryland News]
- Clouds over Amazon rainforests could be affected by storms and ozone -- An international team of researchers led by a meteorology professor from Penn State University report that some thunderstorms that develop over Brazil's Amazon Valley transport atmospheric ozone molecules into the canopy of the central Amazon rainforest, thereby influencing chemical processes that ultimately affect cloud formation over the rainforests. These results were based upon a nine-month monitoring of trace gases, including ozone, and various meteorological variables, such as precipitation and wind speed, under the canopy of the rainforest. The researchers claim that their findings could help improve climate prediction models by being able to more accurately gauge the Amazon's impact on future global weather patterns. [Penn State News]
- Abrupt shift in global climate traced as Ice Age glaciers began to retreat -- Earth scientists at Columbia University's Lamont-Doherty Earth Observatory have been reconstructing the long-term movement of the Intertropical Convergence Zone (ITCZ), or the zone where the large scale atmospheric flow patterns from the Northern and Southern Hemisphere converge and form a band of rainshowers and thunderstorms that essentially encircle the globe along what is also referred to as the "thermal equator." The researchers tracked the position of the ITCZ over the last 150,000 years from isotopic analysis using the thorium-232 isotopes in ocean floor sediment cores collected from three equatorial Pacific Ocean locations near the Line Islands south of Hawaii. During this time, the ITCZ that had been to the north of the Equator moved rapidly south toward the Equator and then back to the north as glaciers in the Northern Hemisphere waxed and waned. [Lamont-Doherty Earth Observatory News]
- National Disaster Resilience Competition winners receive their awards -- Late last week the U.S. Department of Housing and Urban Development (HUD) Secretary and the Rockefeller Foundation announced that a total of $1 billion was being awarded for funding resilient infrastructure and housing projects to a combination of 13 states and communities that were impacted by major Presidentially-declared disasters between 2011 and 2013. [US Dept. of Housing and Urban Development]
- An All-Hazards Monitor -- This Web portal provides the user information from NOAA's National Weather Service, FAA and FEMA on
current environmental events that may pose as hazards such as tropical
weather, fire weather, marine weather, severe weather, drought and
floods. [NOAA/NWS Daily Briefing]
- Earthweek -- Diary of the Planet [earthweek.com]
Return to RealTime Weather Portal
Prepared by Edward J. Hopkins, Ph.D., email hopkins@aos.wisc.edu
© Copyright, 2017, The American Meteorological Society.