Areas of Expertise
Climate Data
View our collection of Wisconsin climate data, which includes temperature, precipitation, snowfall, and other records dating back to the 19th century.
Recent data | Historic data
Wisconsin seasons | First-order stations
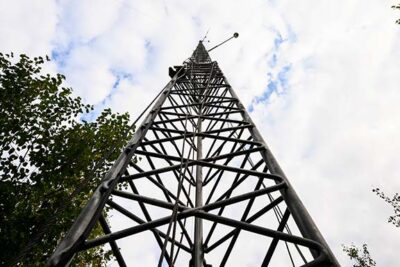
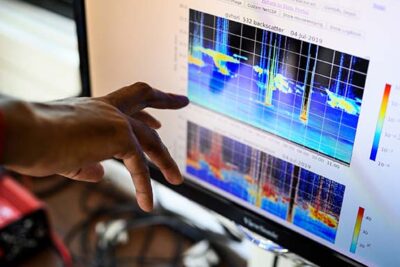
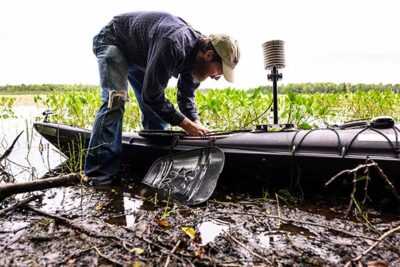
Mesonet
Explore our growing network of real-time weather and soil measurement stations to support Wisconsin farmers, scientists, and citizens.
Research
Learn how we’re addressing the challenges posed by the Wisconsin’s climate, particularly among rural and agricultural communities.
Specialized Climate Information
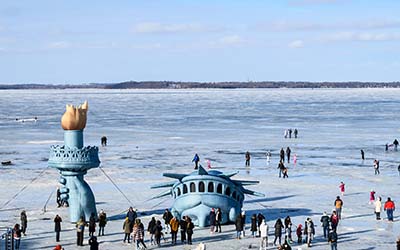
Lake Ice
See the history of freezing and thawing of Madison’s lakes, from 1852 to the present, in addition to current and historical ice conditions on the Great Lakes.
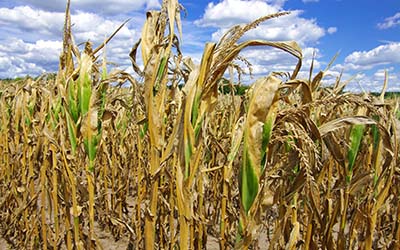
Drought
Get real-time and historical data on drought and moisture conditions across the state.
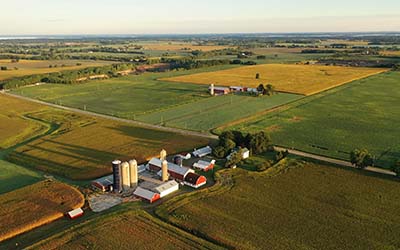
Agriculture
Find local climate and weather information tailored to Wisconsin’s farming community.
Wisconsin Climate Summaries
March 2024 Climate Summary
After a record-breaking February and winter (December to February), Wisconsin’s weather returned to more recognizable conditions during March, although the month was significantly warmer and wetter than normal.
Winter 2023–24 Climate Summary
In what was dubbed a “Lost Winter,” warmth extended through the entire winter season, making it the warmest winter (December to February) since record-keeping began in 1895.
February and Winter 2024 Climate Summary
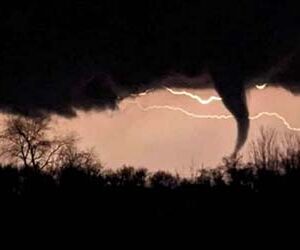
Wisconsin experienced one of its most climatically eventful Februaries, with record-setting warmth and the first recorded February tornadoes in state history.
- View more climate summaries
Wisconsin’s Climate Future
Wisconsin’s climate continues to change. An analysis of past climate data confirms that our state is getting warmer and wetter. How will our communities be affected, and what can they do to adapt? The Wisconsin Initiative on Climate Change Impacts, a partnership between the Nelson Institute for Environmental Studies and Wisconsin Department of Natural Resources, identifies vulnerability to climate change and works to improve our resilience and readiness.