Wisconsin Climate Watch
July 2023 Wisconsin Climate Summary
Steve Vavrus, PhD, State Climatologist
Drought strengthens across Wisconsin
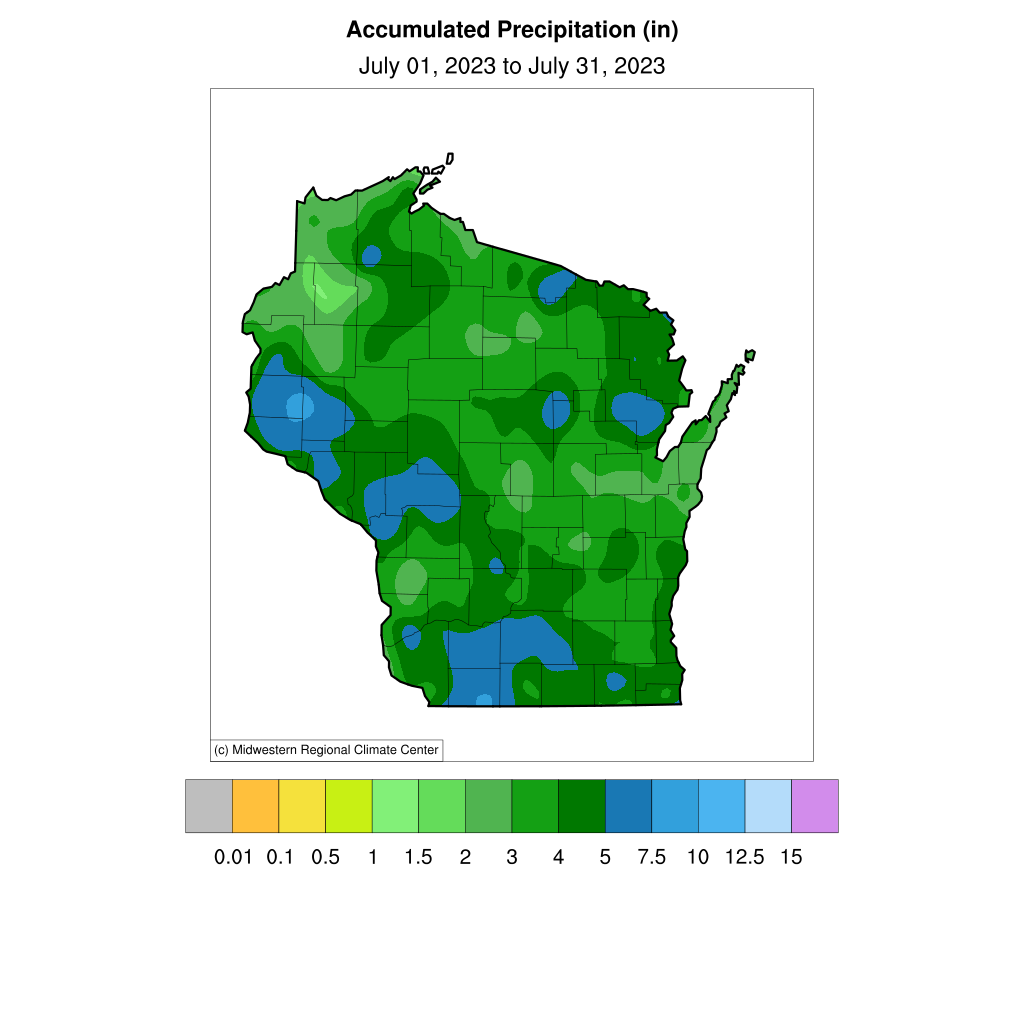
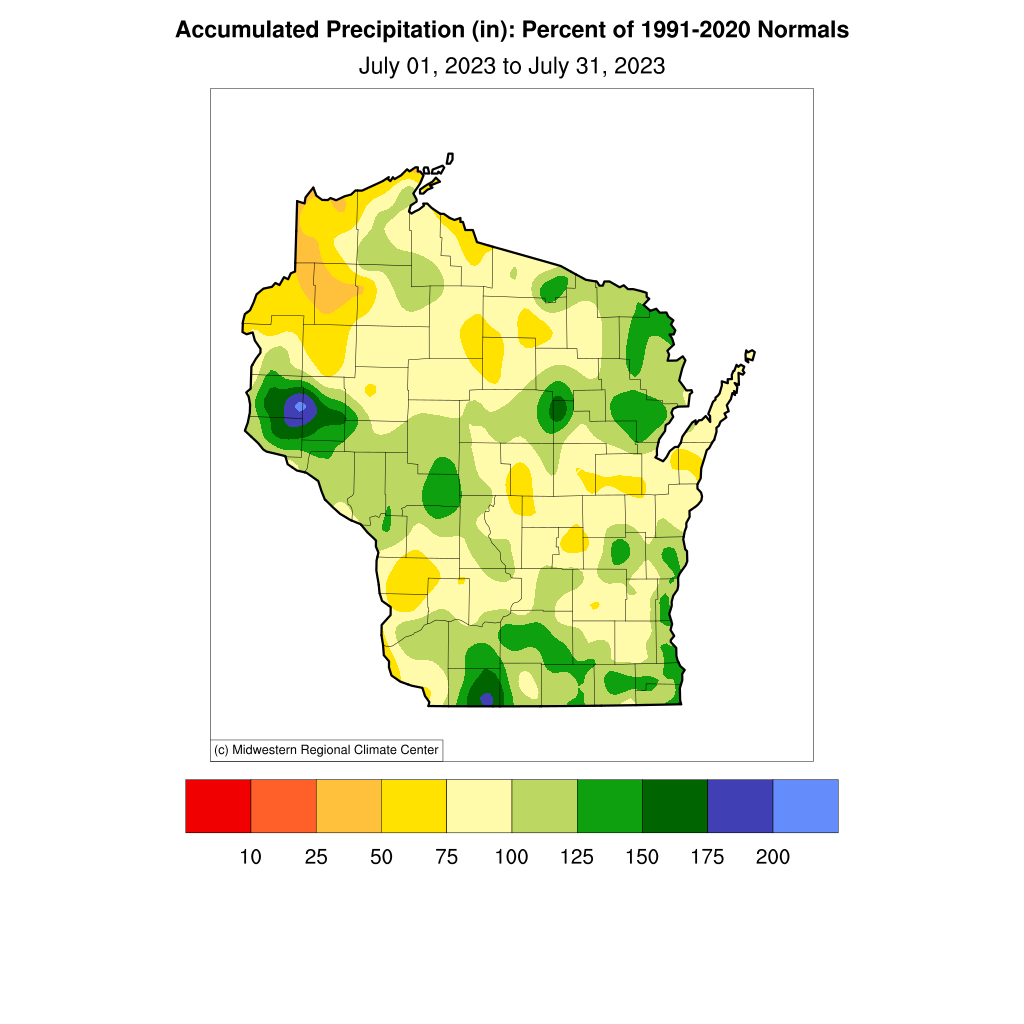
Drought conditions expanded in Wisconsin during July, despite greater rainfall than during the preceding two months. The statewide-average precipitation of 3.75 inches during July was actually unremarkable: 0.29 inches below the 1991-2020 normal and the 69th driest in the 129 years of record-keeping. Most parts of the state received near-normal rainfall in excess of 3 inches, except for the northwest. Within this region the counties of Douglas, Washburn, Barron and Burnett were especially dry, with less than 75% of normal precipitation. Even though rainfall rebounded during July in most of the state, it wasn't nearly enough to make up for the acute deficits Wisconsin endured in the late spring and early summer. In fact, the state endured its fifth driest May-July period on record.
 |
 |
The long-term dryness and scattered nature of heavy rainfall during July led to a substantial strengthening of drought across Wisconsin last month. The final map from the "U.S. Drought Monitor" during the last week of June (27 June 2023) showed moderate drought over most of the state and severe drought covering a large portion of the southwest and south-central regions, in addition to a small sliver in the far northwest. By the end of July (25 July), the vast majority of Wisconsin experienced either no improvement or worsened conditions. The most notable degradation occurred in the southwest and south-central areas, along with the northern part of Douglas and Bayfield Counties near Lake Superior. The parched soils and vegetation were conducive to a significant wildfire in Waushara County on July 10th that consumed nearly 1,000 acres and forced the evacuation of 100 properties. 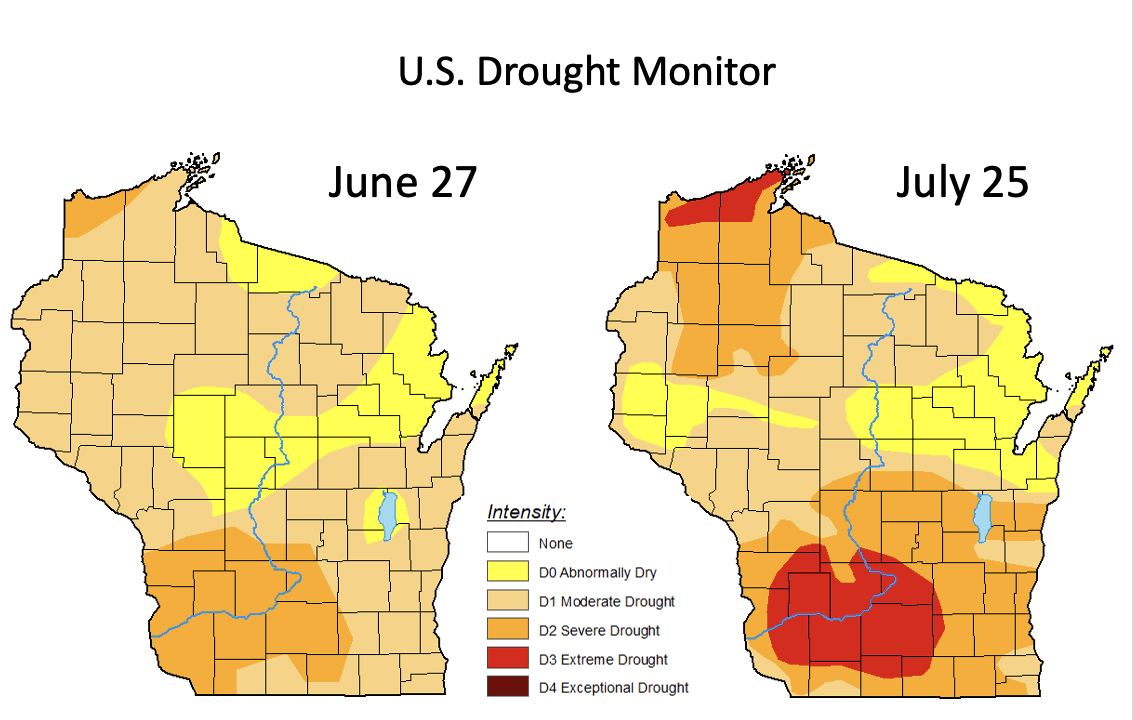
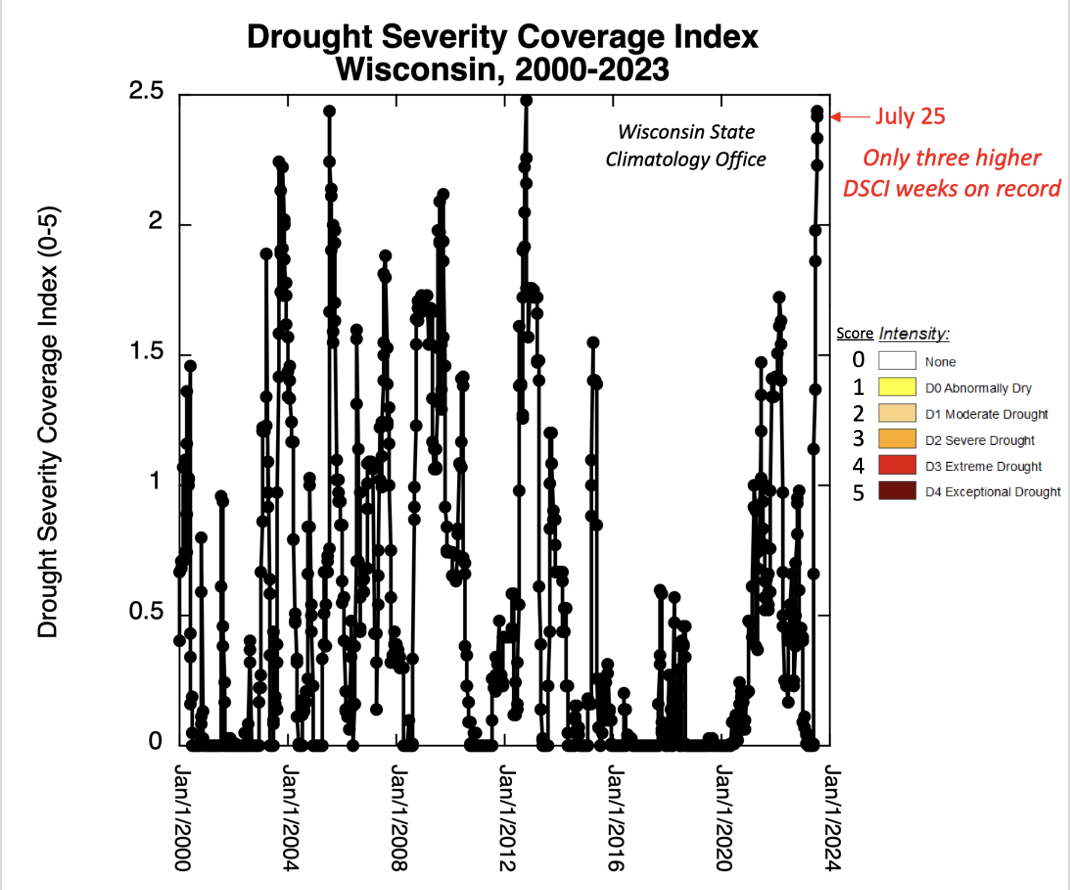
A useful measure of the combined severity and areal extent of a drought is the Drought Severity Coverage Index (DSCI) reported each week by the U.S. Drought Monitor. The DSCI is the weighted spatial average of all five drought categories, after assigning a score to each. The weakest category (D0, "abnormally dry") receives a score of one, D1 ("moderate drought") a two, D2 ("severe drought") a three, D3 ("extreme drought") a four, and D4 ("exceptional drought") a five. Therefore, the DSCI can range from as low as 0 in the absence of any drought to as high as 5 if the entire state were in exceptional drought. As illustrated below, the final "Drought Monitor" map issued in July translated to one of the highest DSCI values (2.42) since the maps began in 2000. Except for the very slightly higher index two weeks prior, the only other instances of (barely) greater magnitude drought in Wisconsin were one week during the infamous 2012 drought and another week during July 2005. The DSCI graph also depicts the extremely rapid onset of this year's drought, as well as how unusual the current conditions have been compared with most of the exceptionally wet 2010s decade, Wisconsin's wettest on record.
Too much of a good thing
The overall precipitation totals during July are somewhat misleading, because much of the rain fell in heavy doses that overwhelmed the ability of vegetation and soils to absorb it all. In addition, some of these intense storms were severe and led to power outages and flash floods. An example was the July 28th severe thunderstorm outbreak in southern Wisconsin, which generated large hail and dumped localized rainfalls exceeding 2 inches. The deluge was especially pronounced in Dane County, where urban flooding occurred. There were also widespread power outages affecting more than 20,000 customers throughout the southern half of the state.

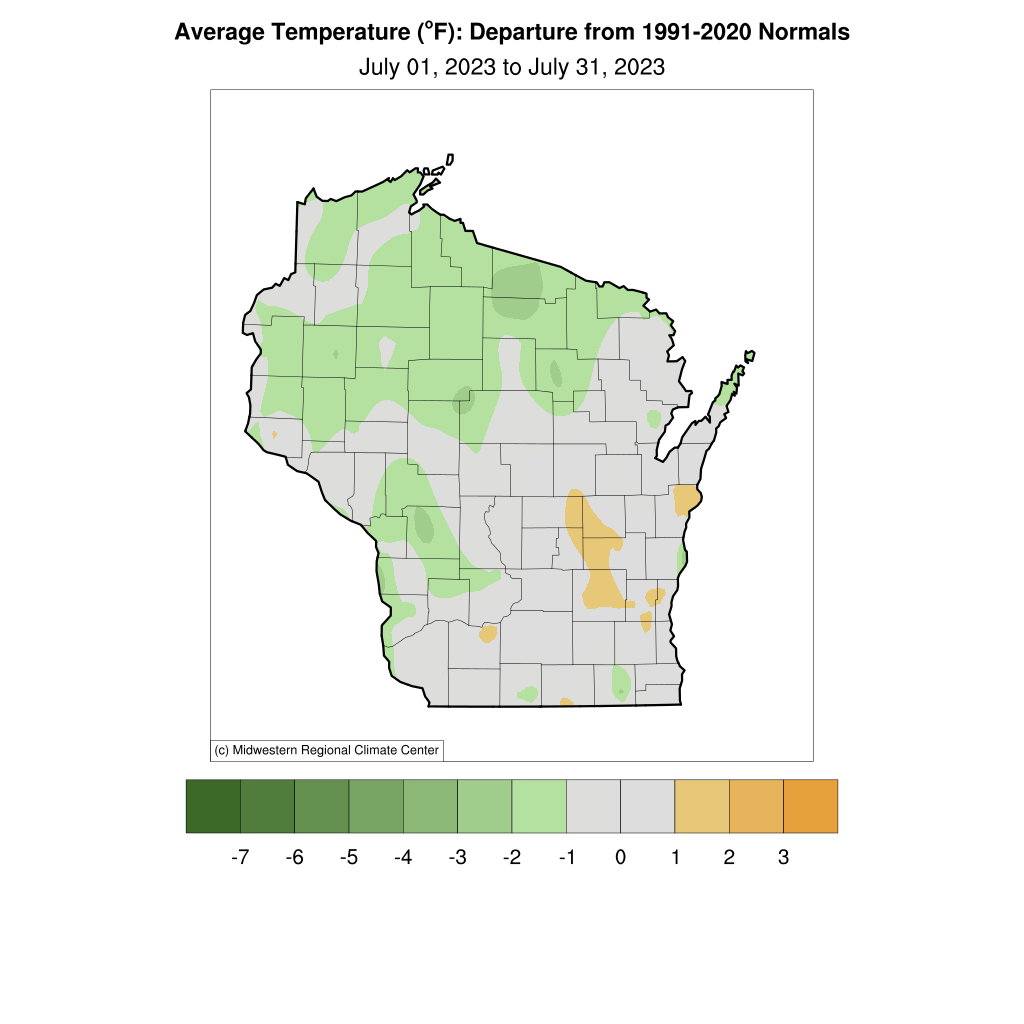
A comfortable July
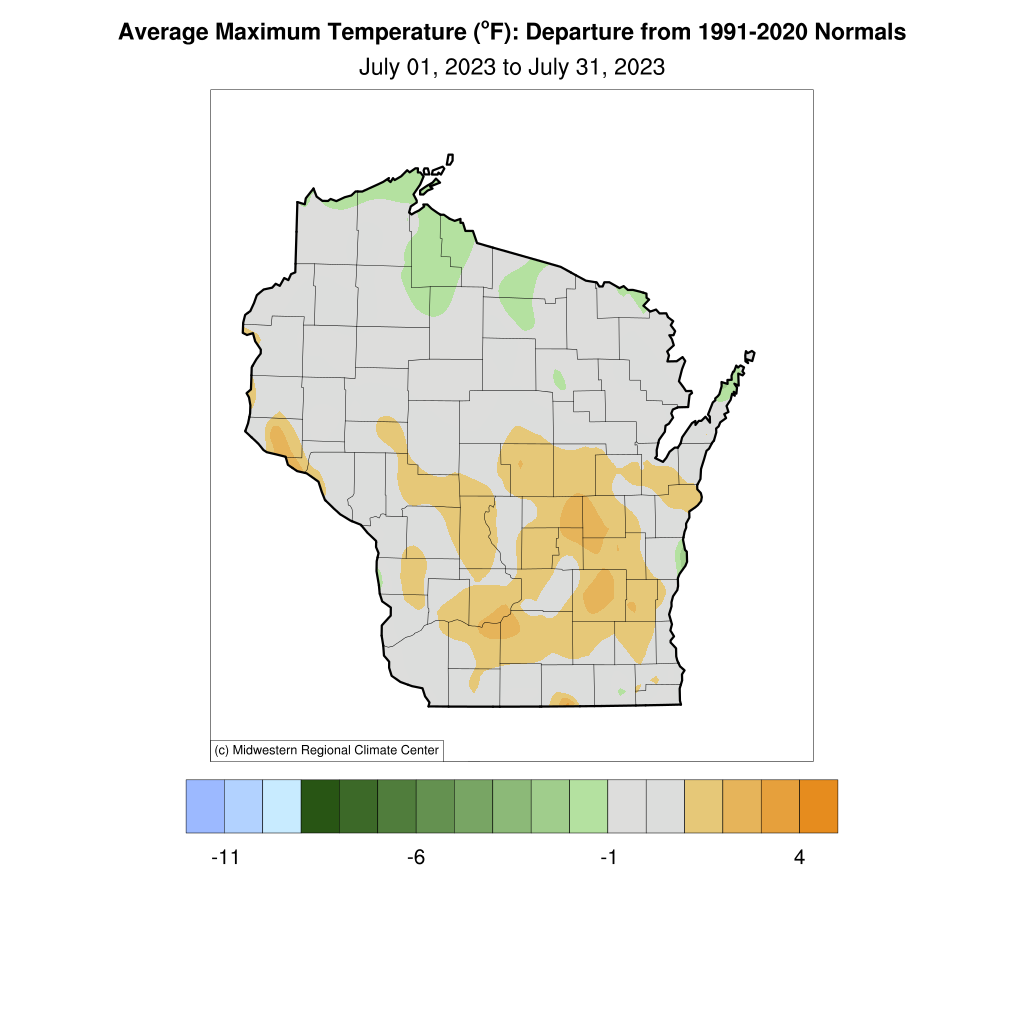
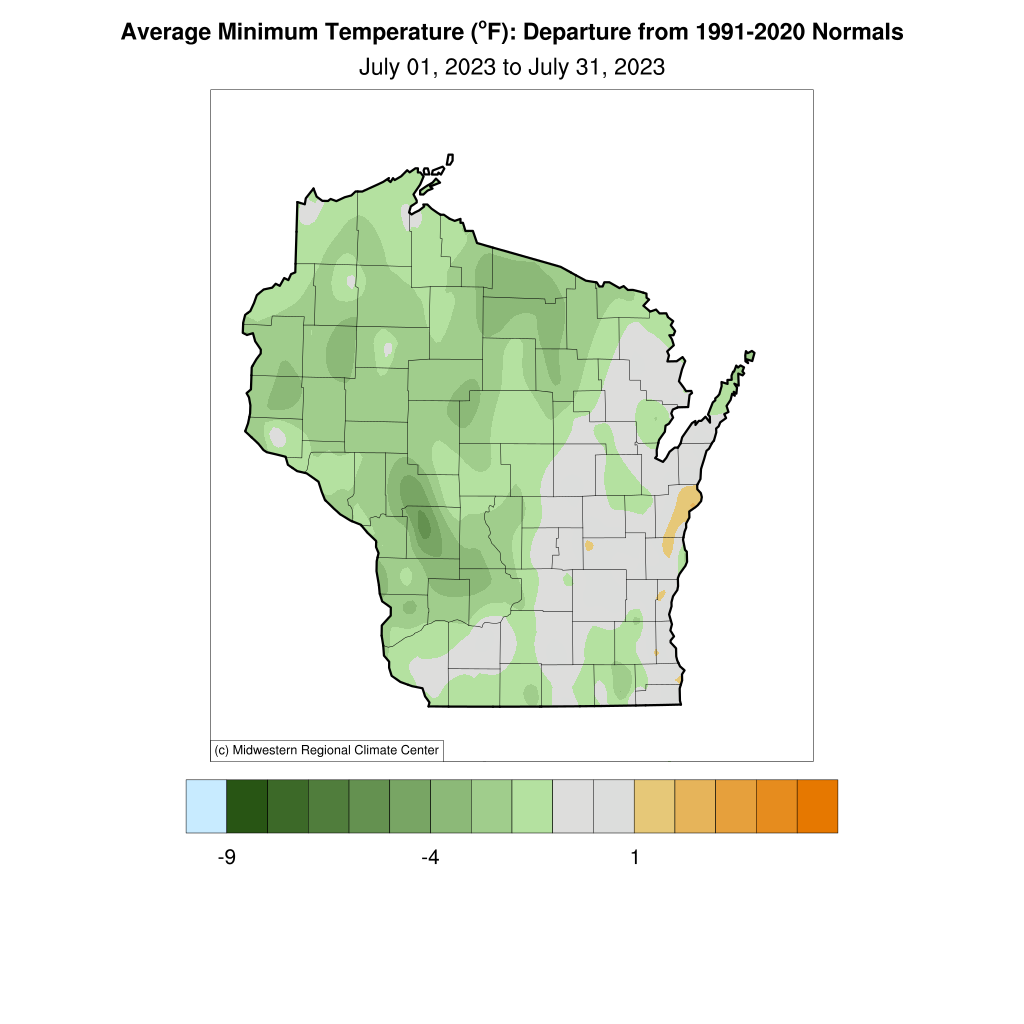
Although major droughts often coincide with exceptional heat (e.g., the summers of 2012 and 1988), temperatures during July were quite moderate. In fact, Wisconsin's average temperature last month of 68.5°F was slightly cooler (by 0.7 degrees) than the 1991-2020 mean, and most of the state landed within 1 degree of normal. There were also relatively few hot days, as exemplified by the modest frequency of temperatures exceeding 90 degrees. None of the "first-order" weather stations around the state (Eau Claire, Wausau, Green Bay, Milwaukee, Madison and La Crosse) registered more than a handful of these hot days during July. The prevalence of dry air during the drought was especially effective at promoting nighttime cooling, because low humidity enables Earth's surface to shed heat to space efficiently. Most of Wisconsin experienced overnight low temperatures during July of more than 1 degree below normal, and negative anomalies were greater than 3 degrees in many places.
The moderate temperatures last month continued the trend since the drought began. Wisconsin's three-month average temperature from May through July was only 0.8°F higher than the 1991-2020 normal. The weather during this period was thus not only mostly comfortable, but the absence of extreme heat significantly tempered the worst impacts of the drought. Wisconsin was the outlier, however, compared with other parts of the world. The globally averaged temperature reached a record-high during July, and the southern U.S. baked under record-breaking heat. The most affected states were Arizona and Florida, which suffered through their most extreme July temperatures in the 129-year record. Fortunately for Wisconsin, the southern heat dome remained mostly stationary last month.
|