Wisconsin Climate Watch
-"Real-Time Climate Variability"
This page focuses on the recent weather and
climate for Wisconsin on time scales that range
from the last seven days to the last 12 months.
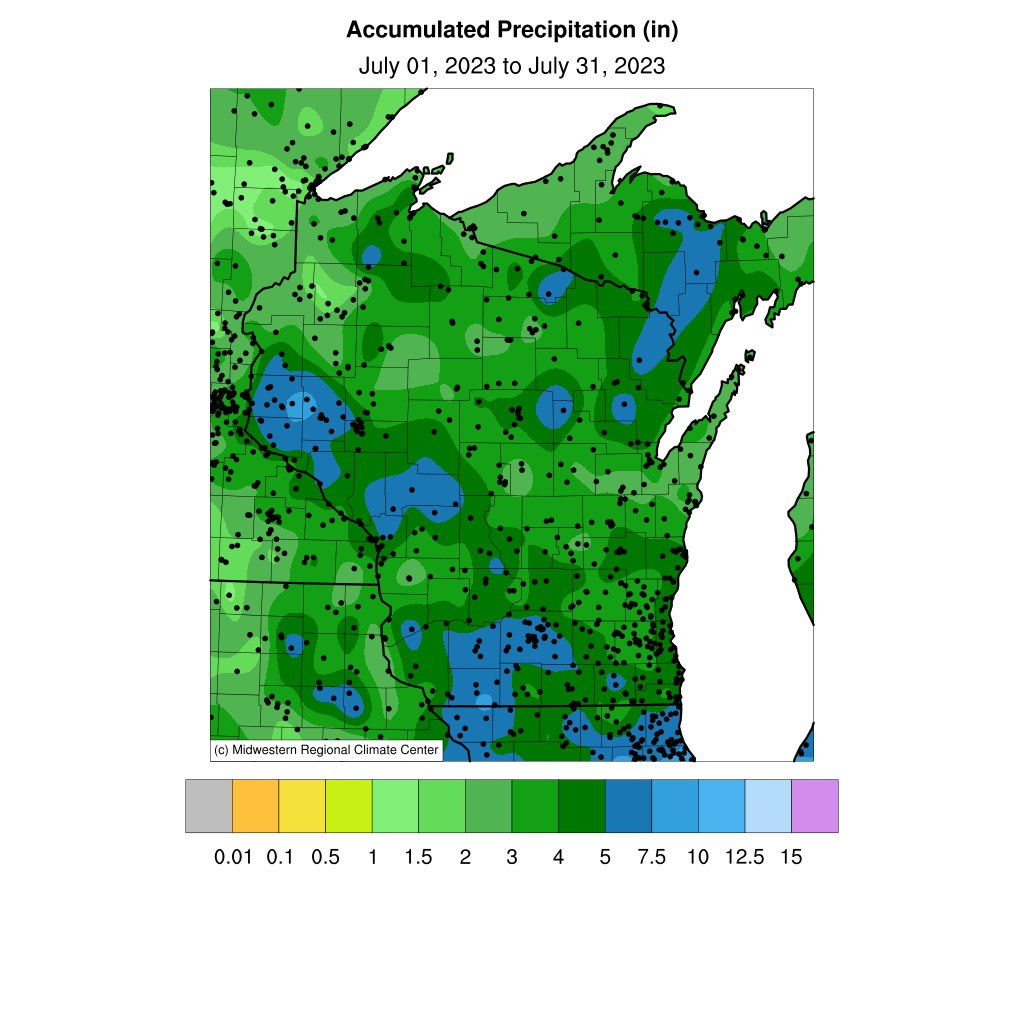
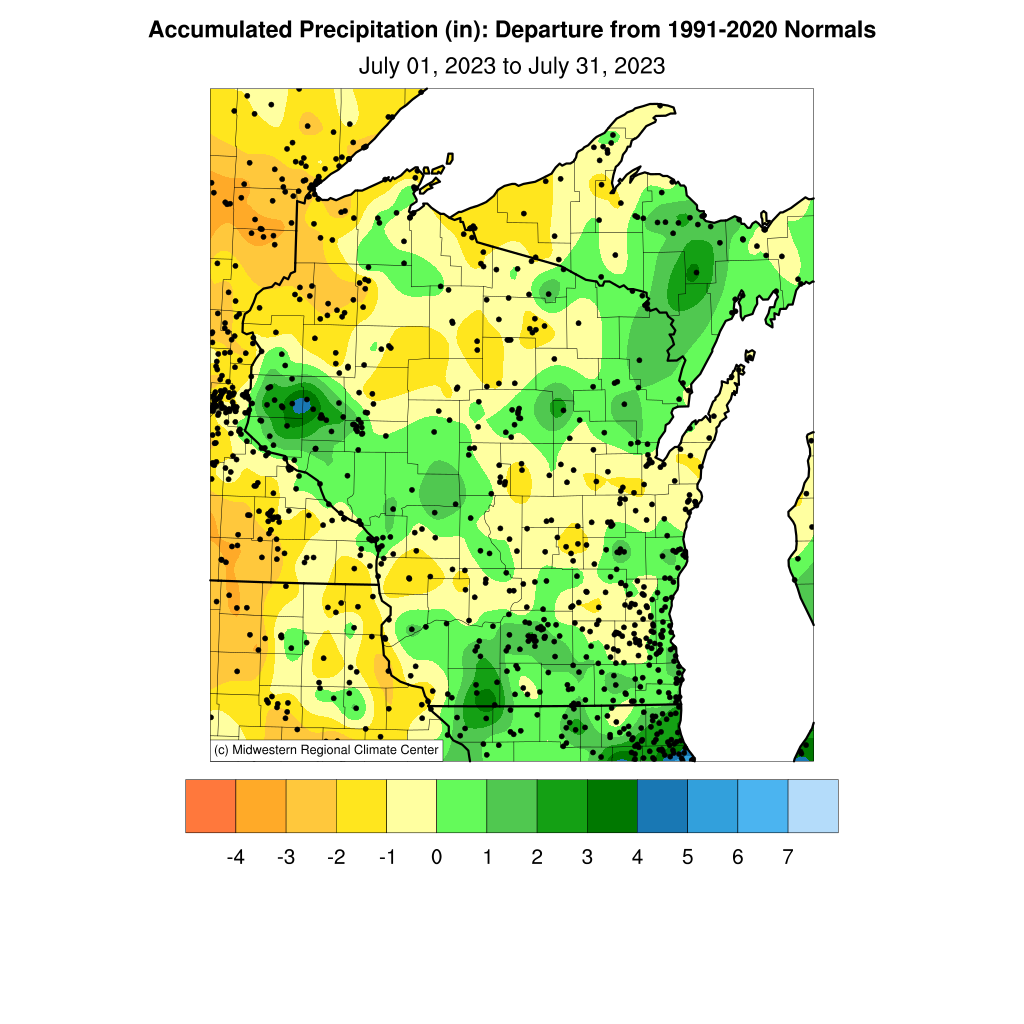
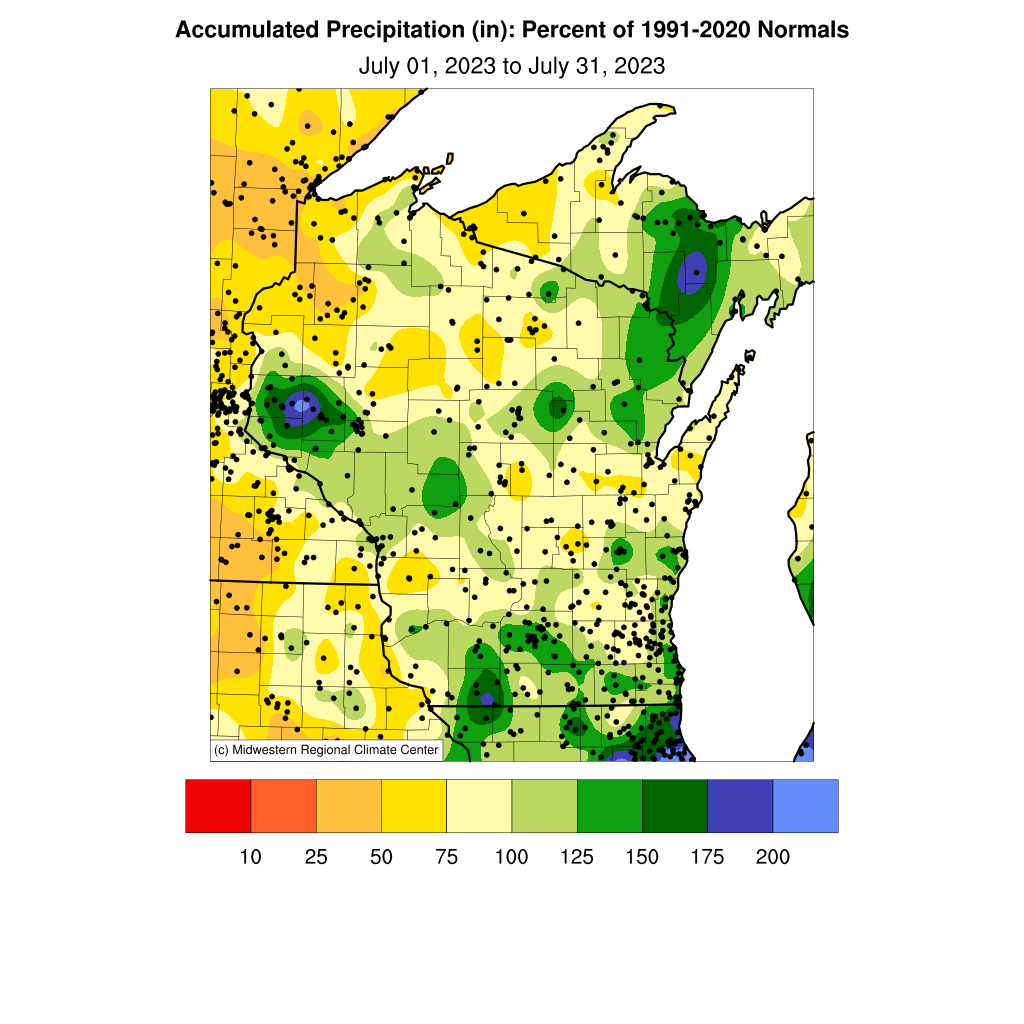
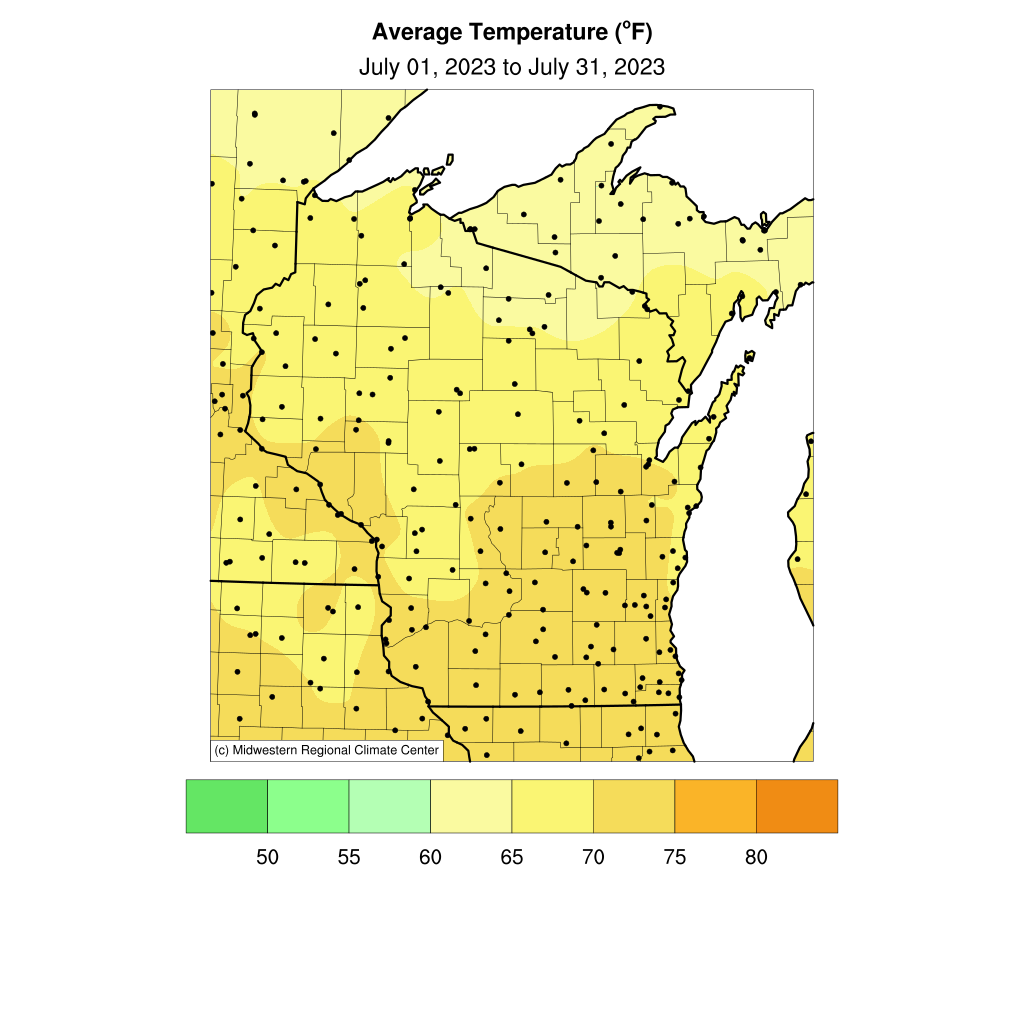
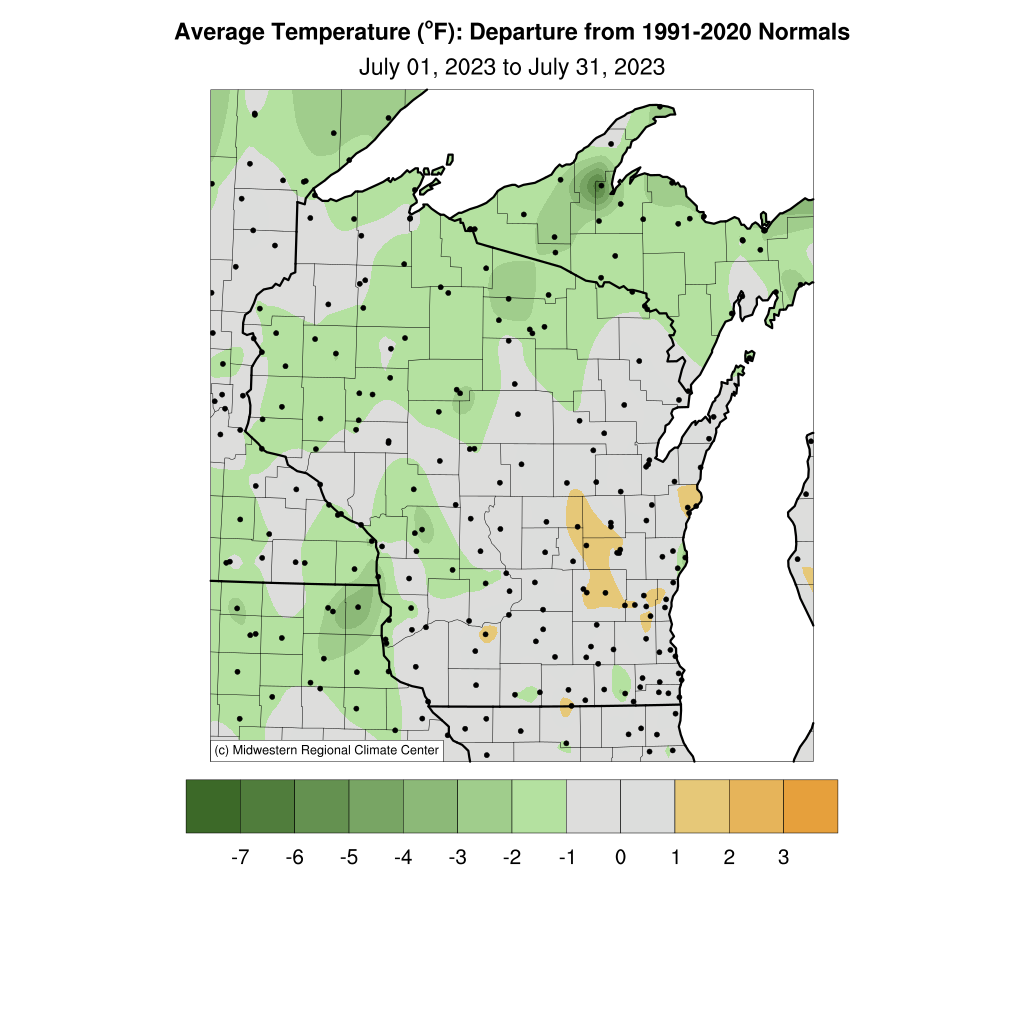
July 2023 Wisconsin Climate Summary
Drought strengthens across Wisconsin
Drought conditions expanded in Wisconsin during July, despite greater rainfall than during the preceding two months. The statewide-average precipitation of 3.75 inches during July was actually unremarkable: 0.29 inches below the 1991-2020 normal and the 69th driest in the 129 years of record-keeping.
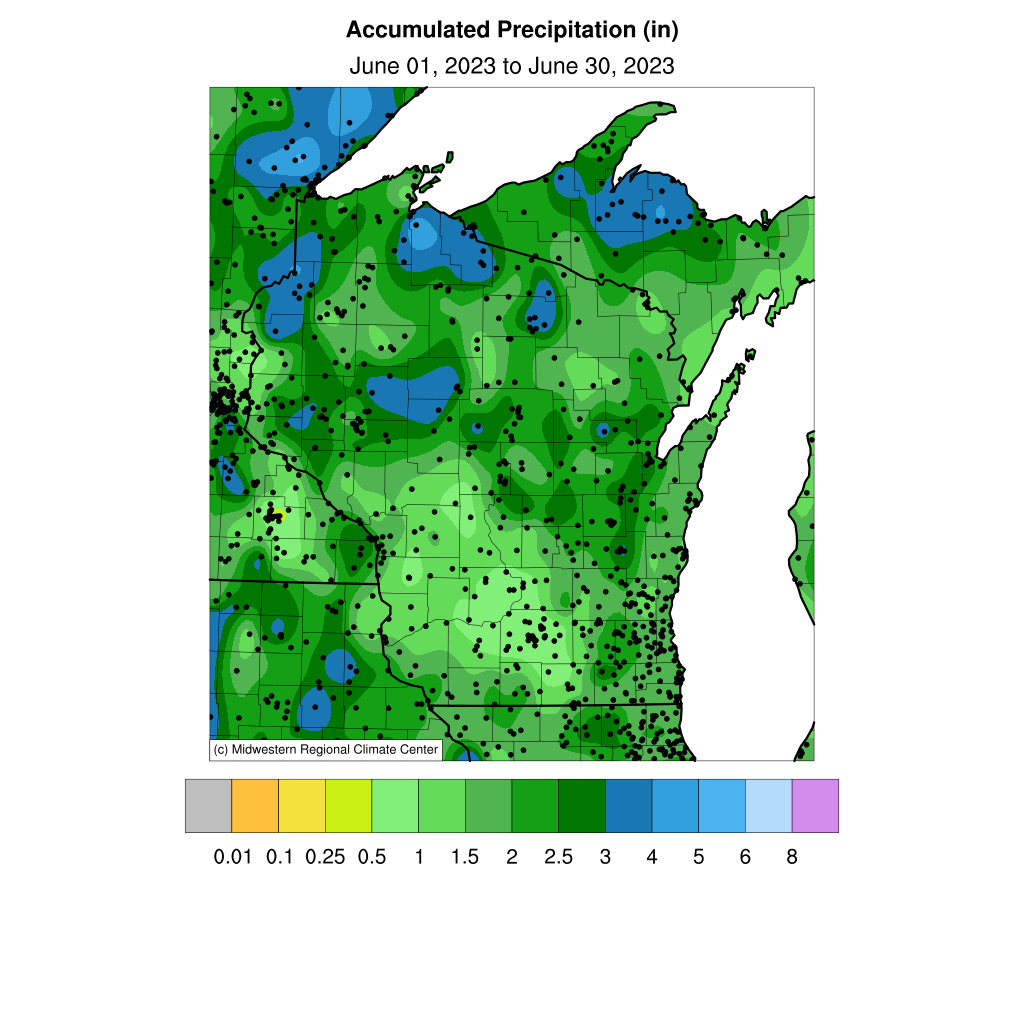
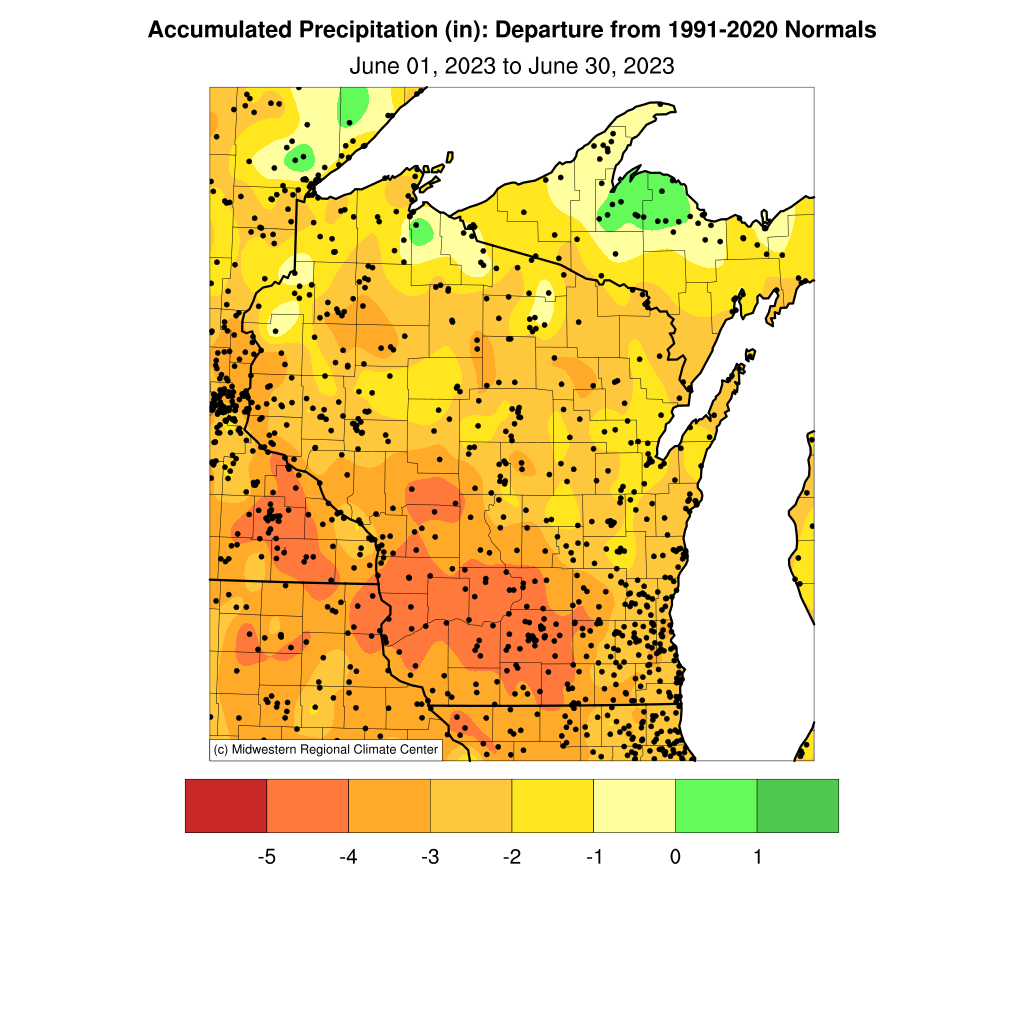
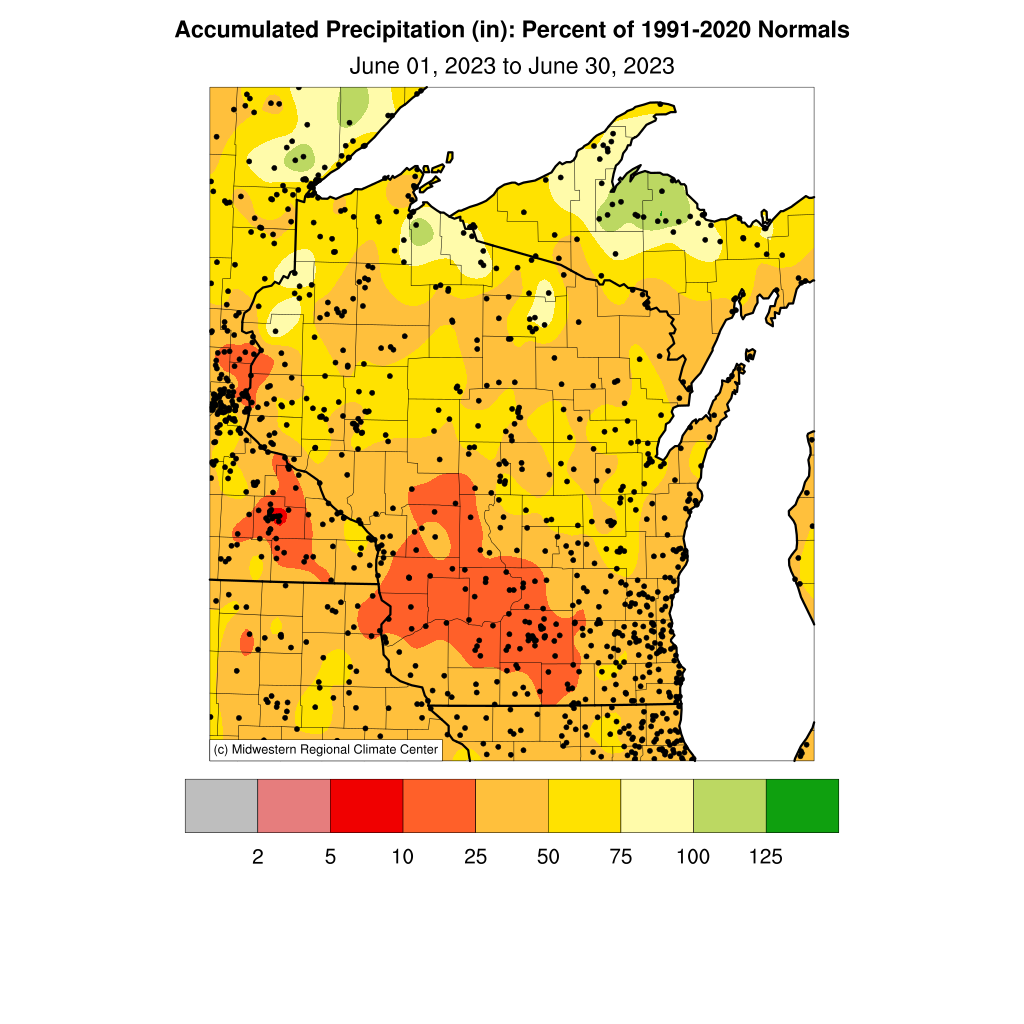
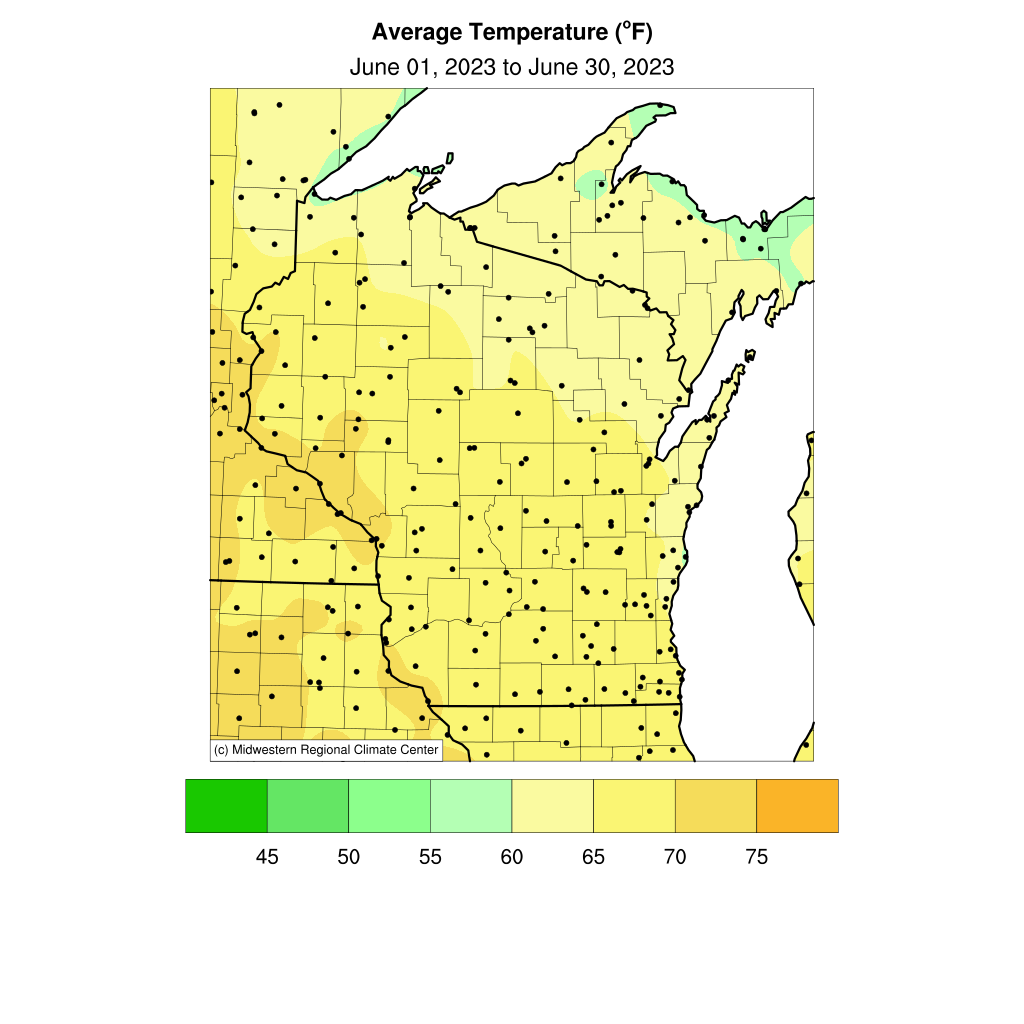
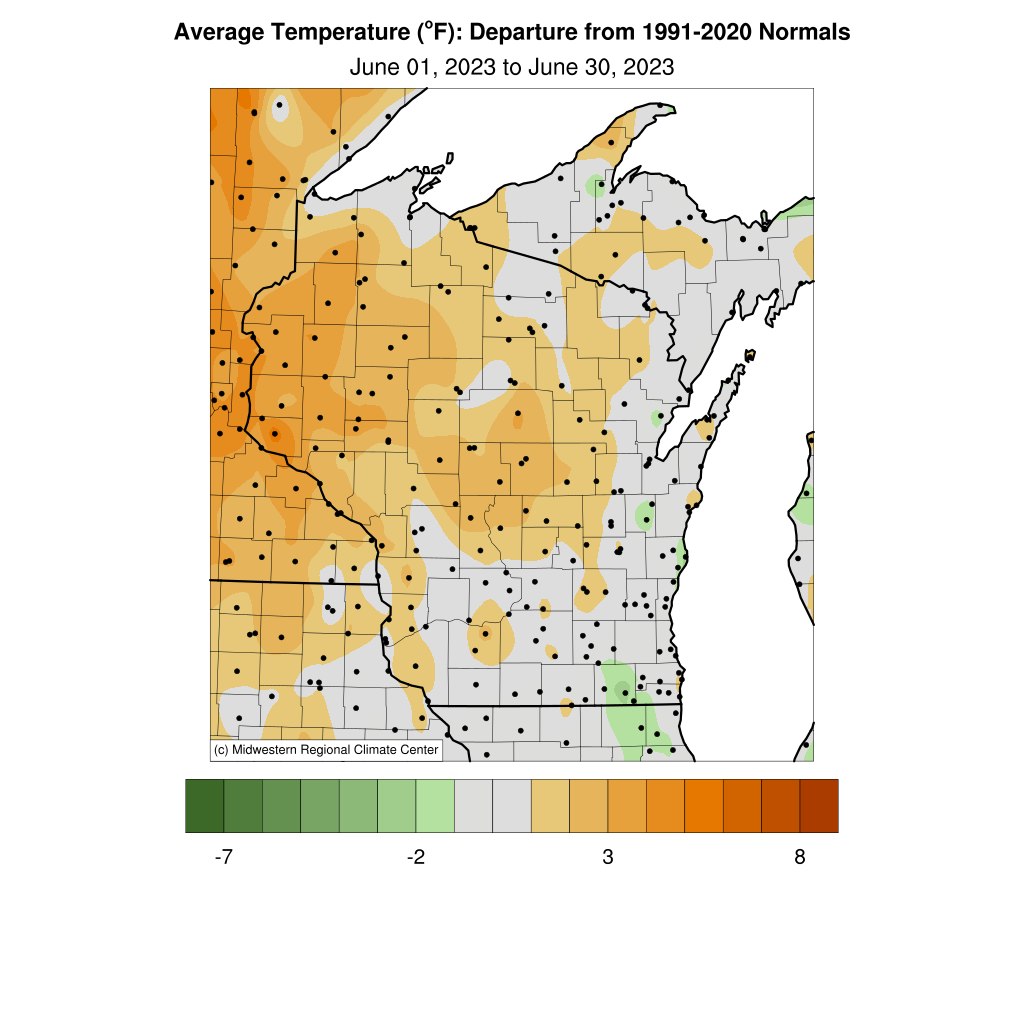
June 2023 Wisconsin Climate Summary
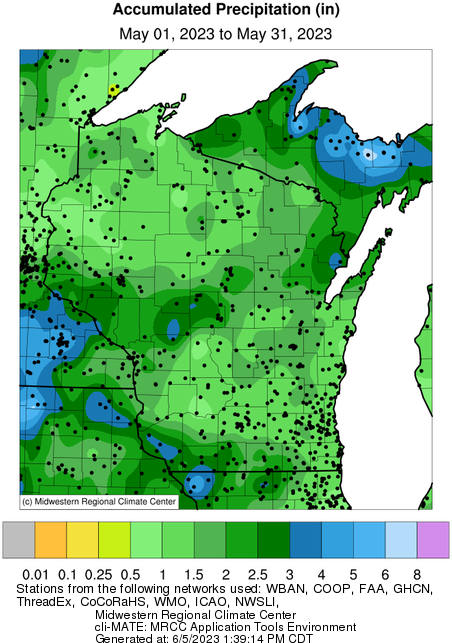
Dryness continues from May through June
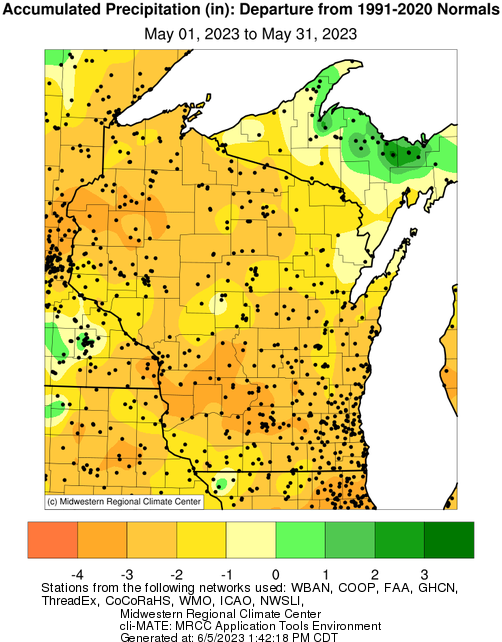
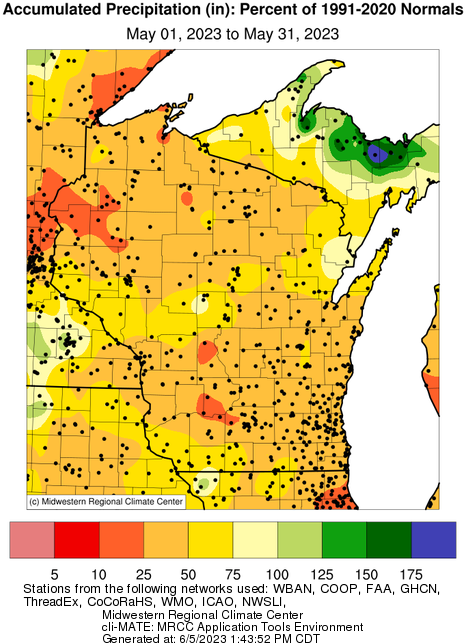
Drought conditions emerged rapidly in Wisconsin during June. On the heels of the 4th driest May on record (since 1895), June followed suit in becoming the 5th driest on record with only 1.91 inches of rain averaged statewide.
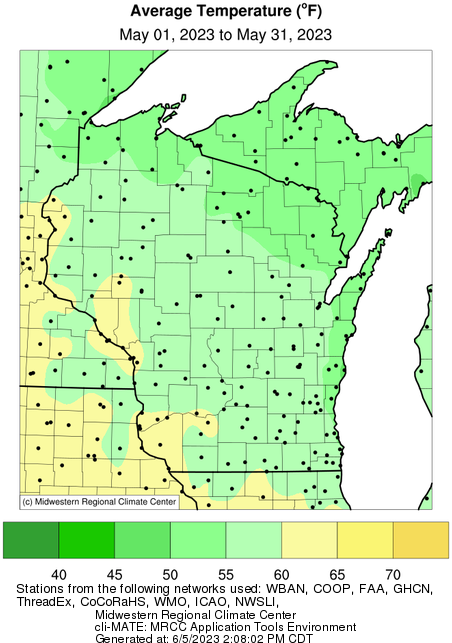
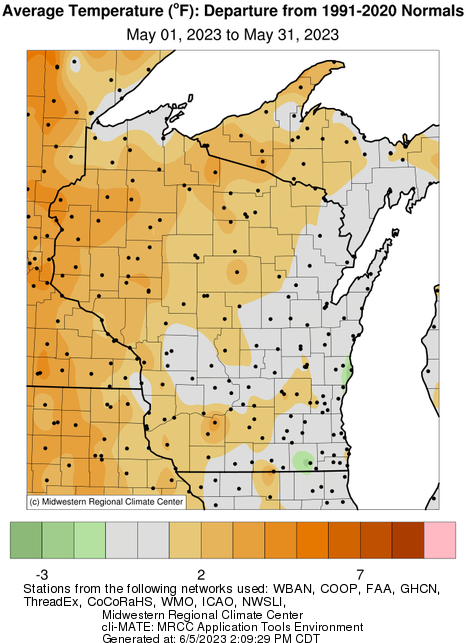
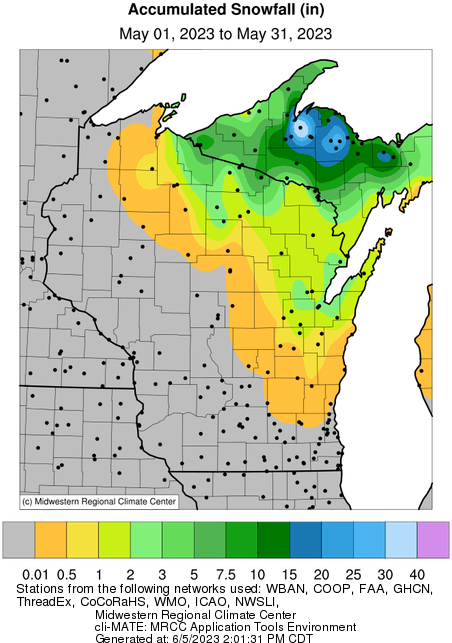
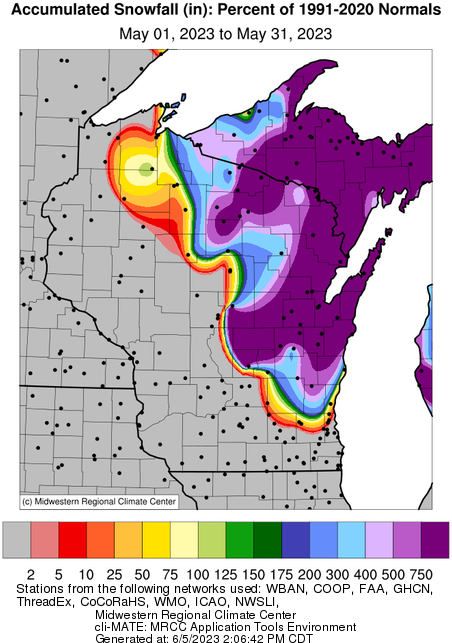
May 2023 and Spring 2023 Wisconsin Climate Summary
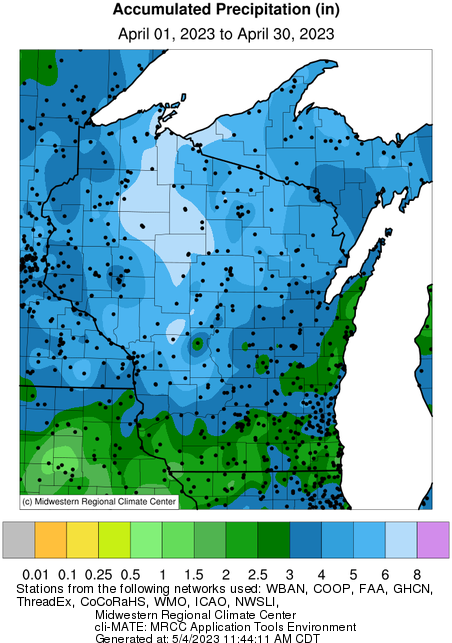
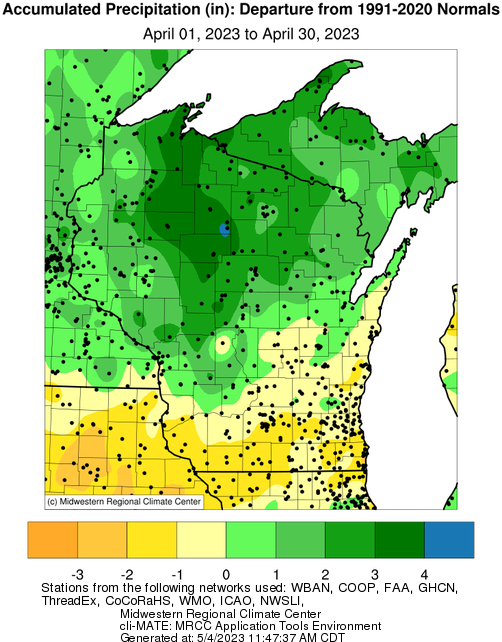
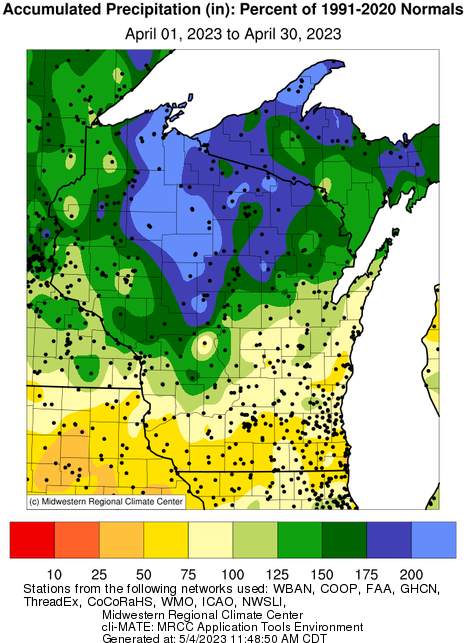
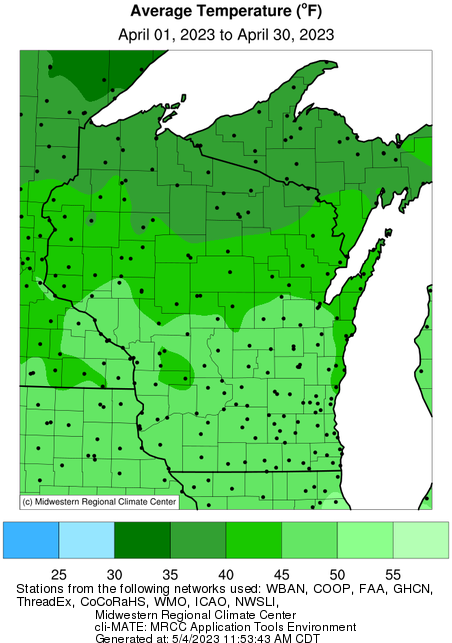
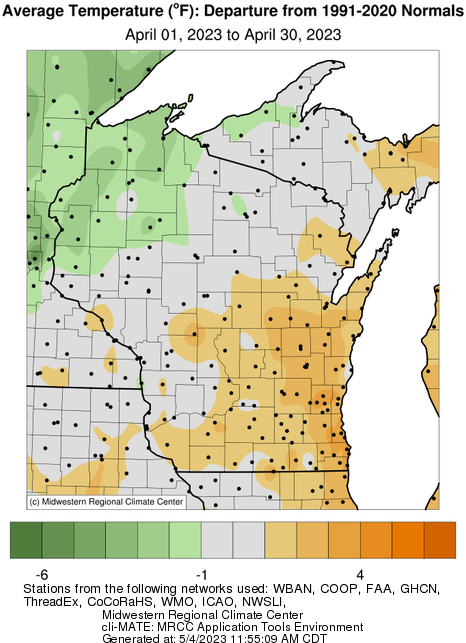
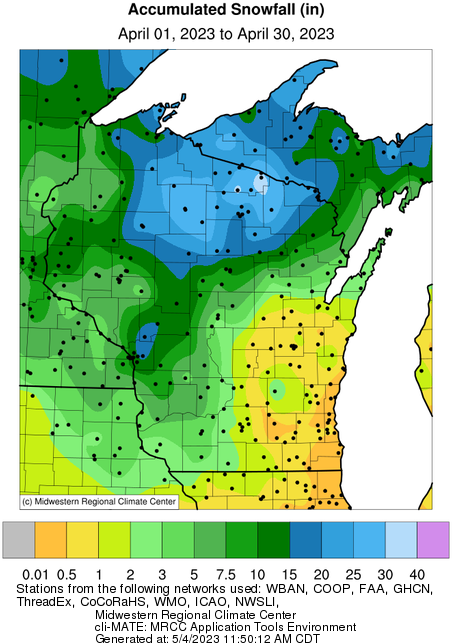
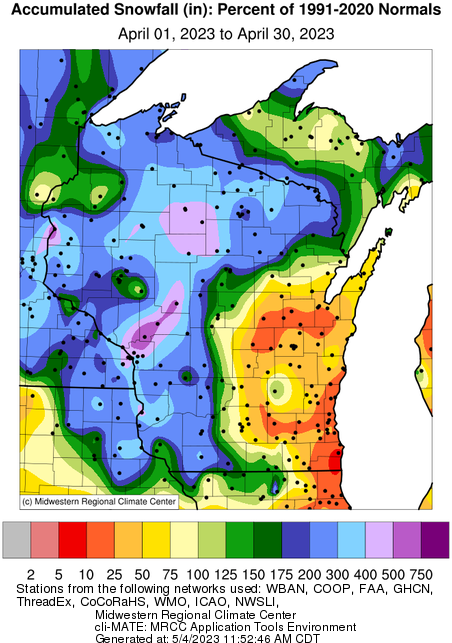
April 2023 Wisconsin Climate Summary
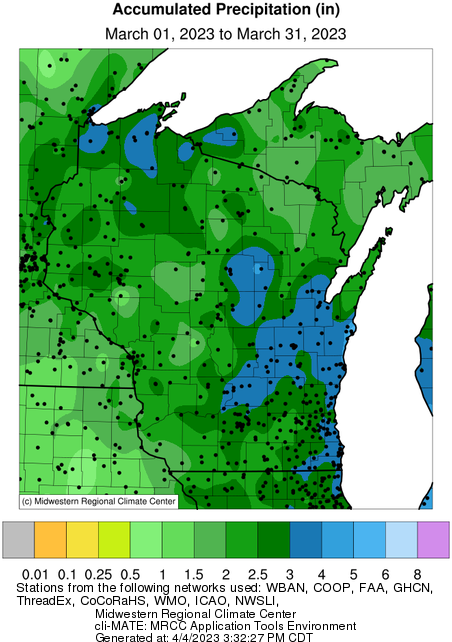
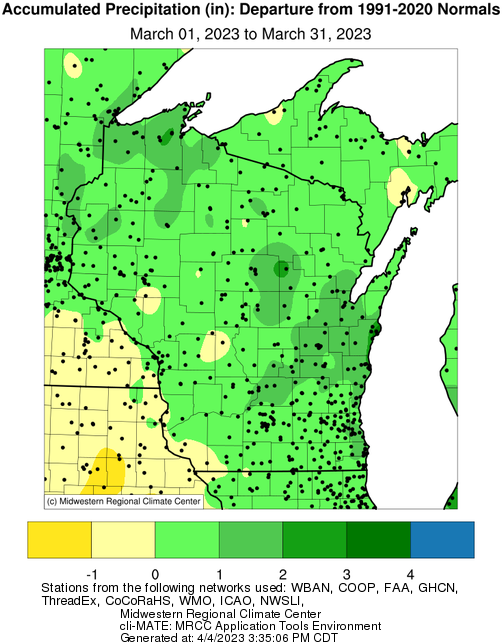
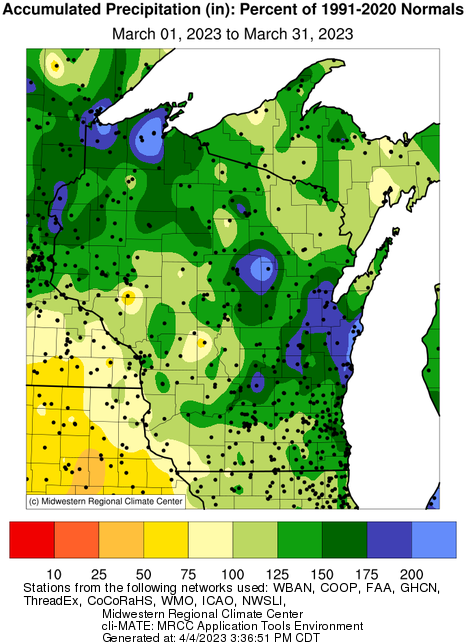
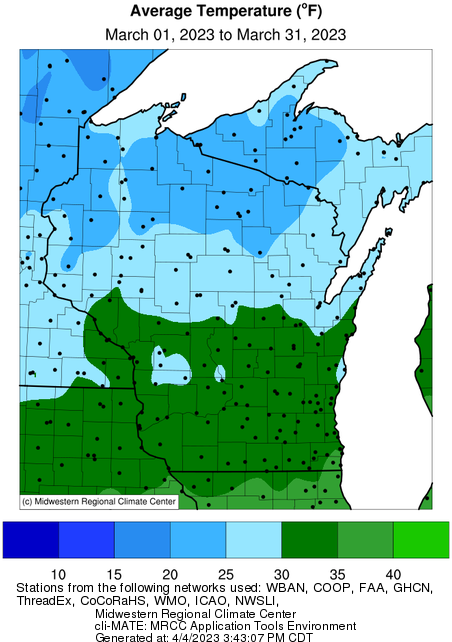
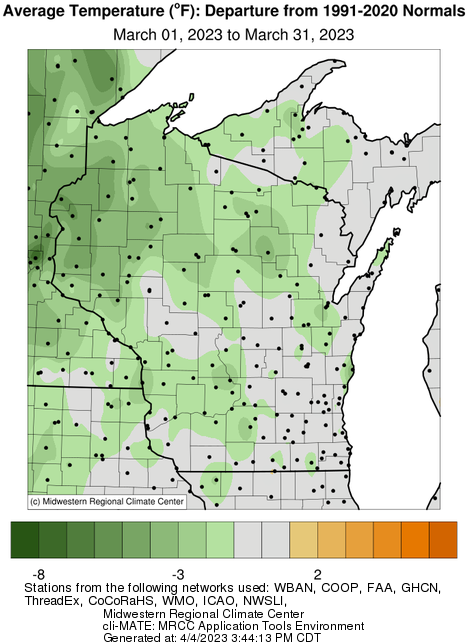
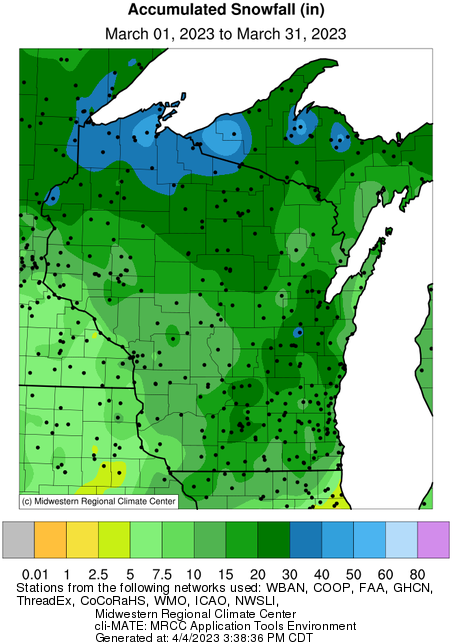
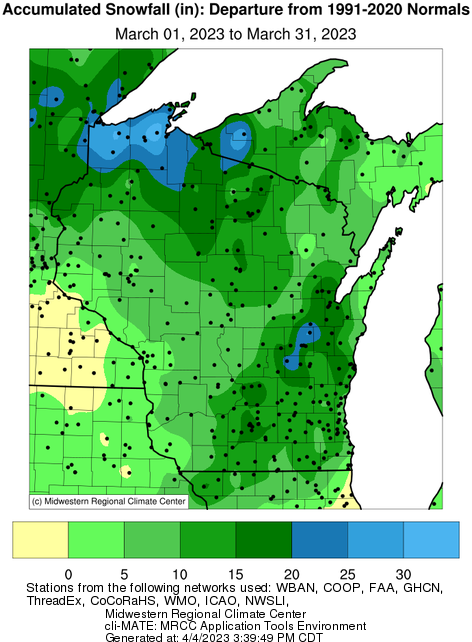
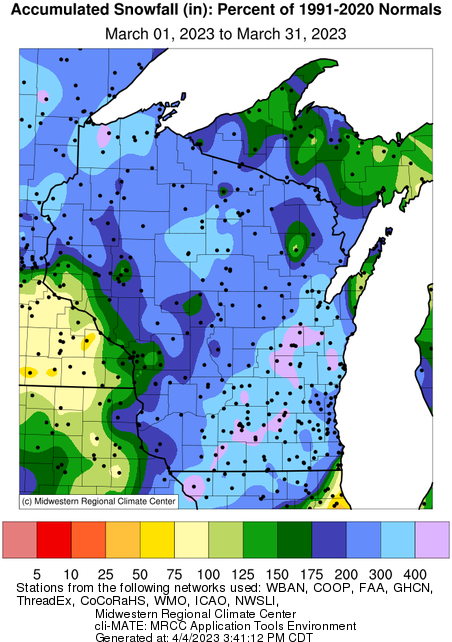
March 2023 Wisconsin Climate Summary
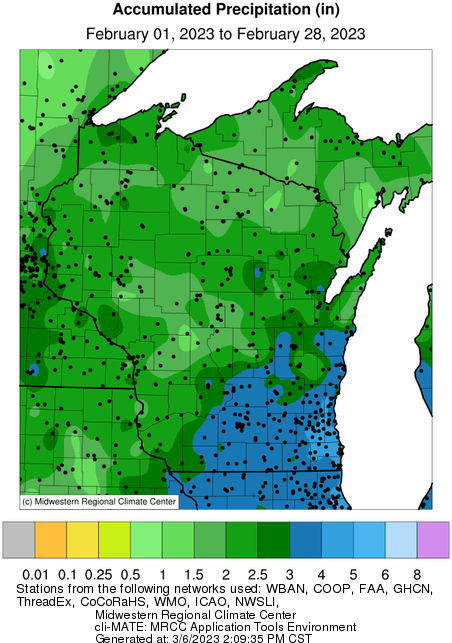
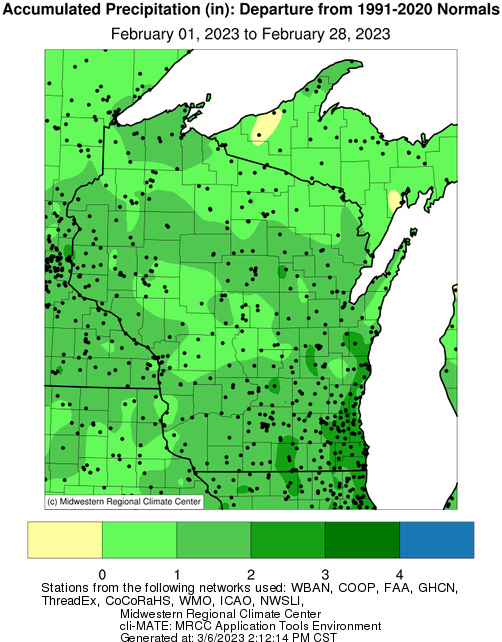
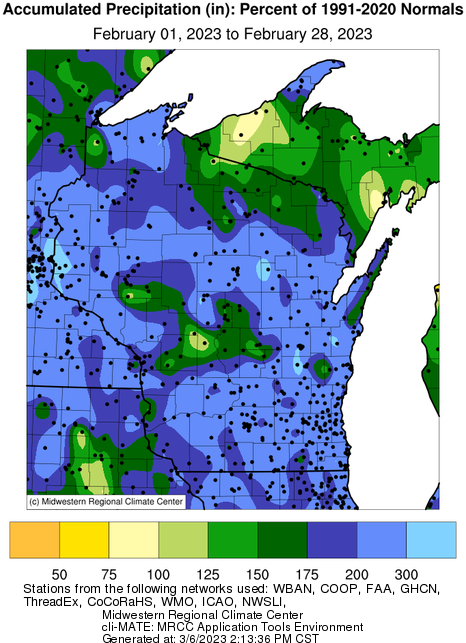
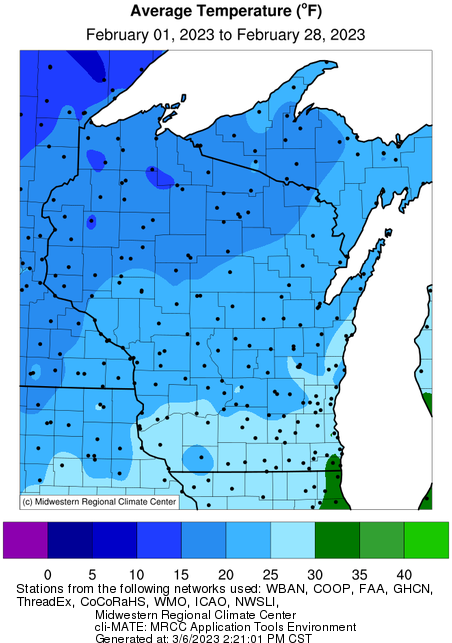
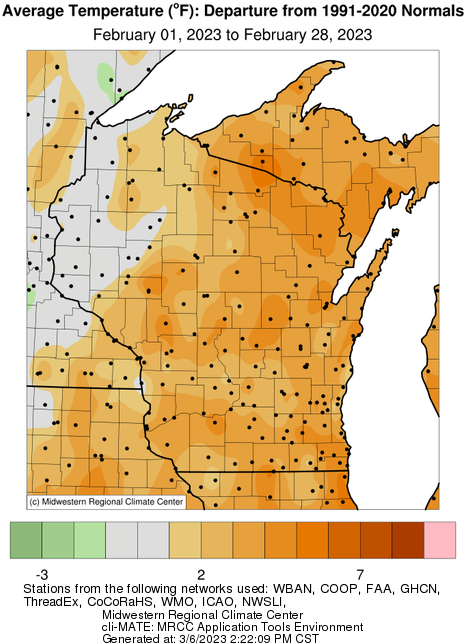
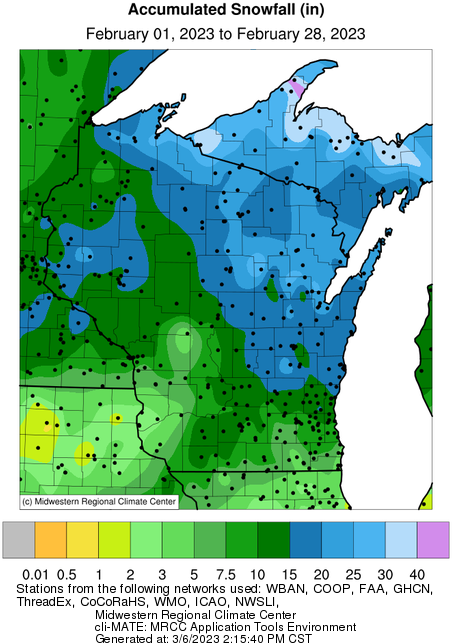
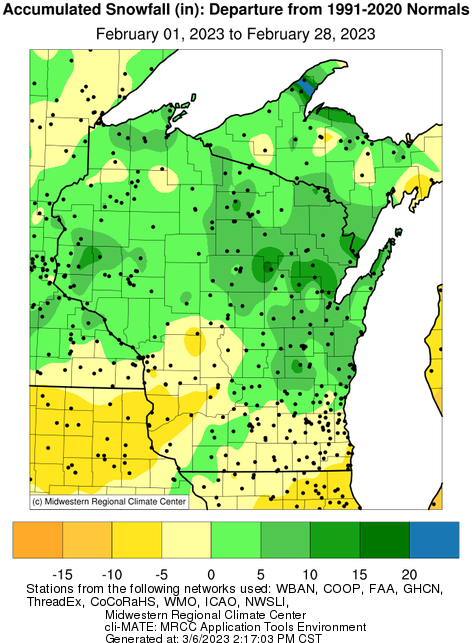
February 2023 and Winter 2022-2023 Wisconsin Climate Summary
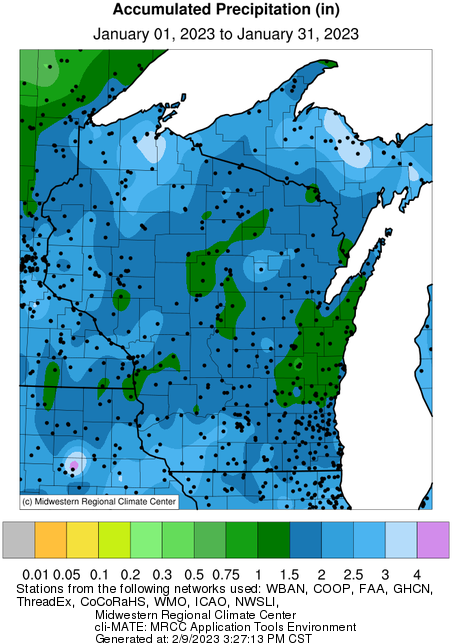
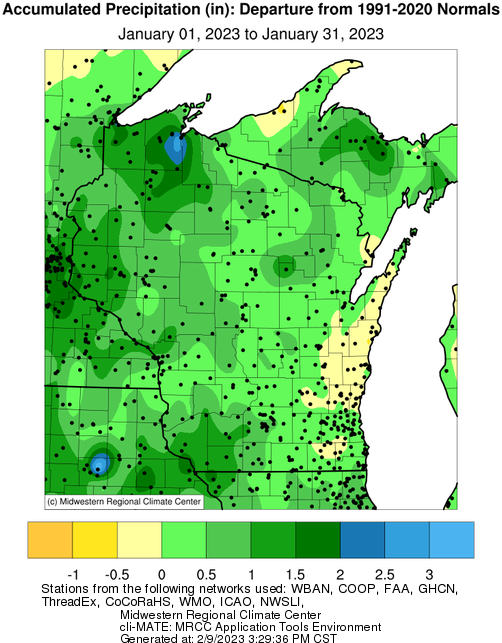
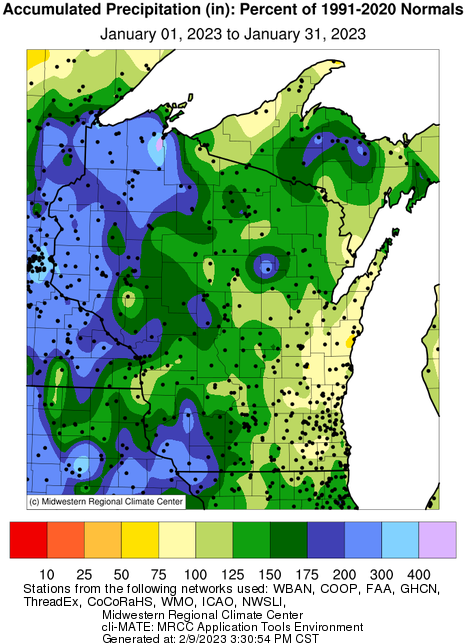
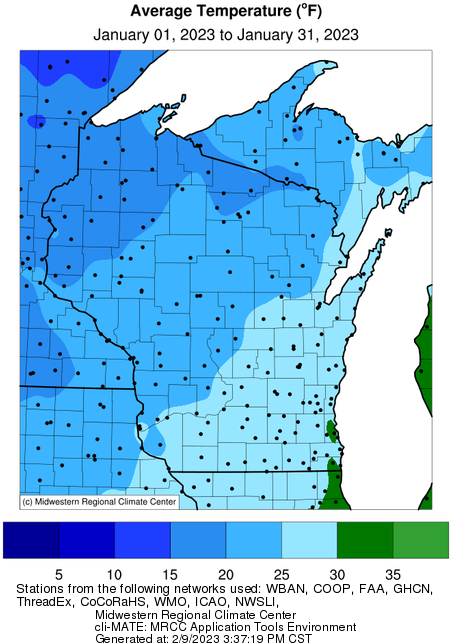
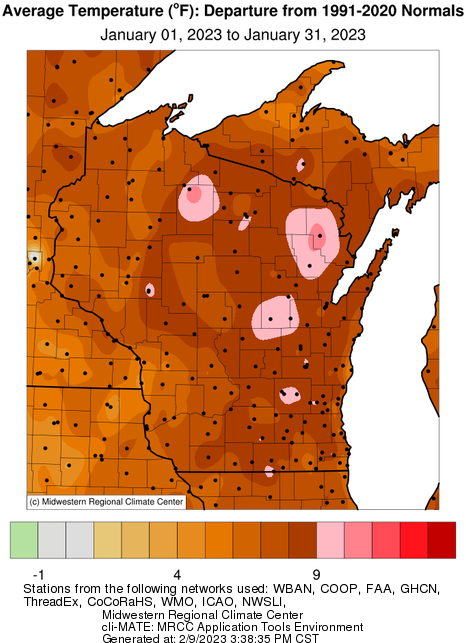
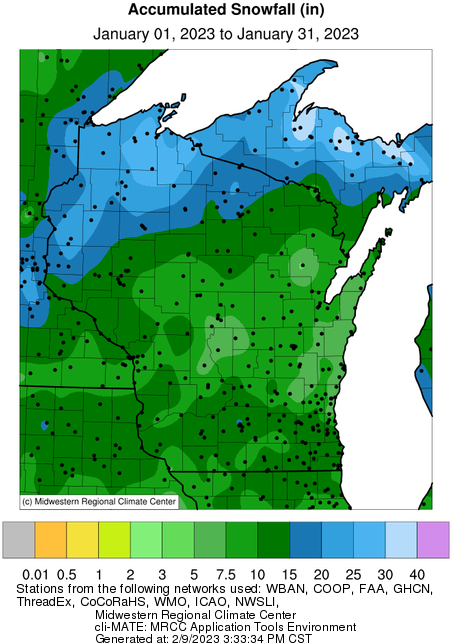
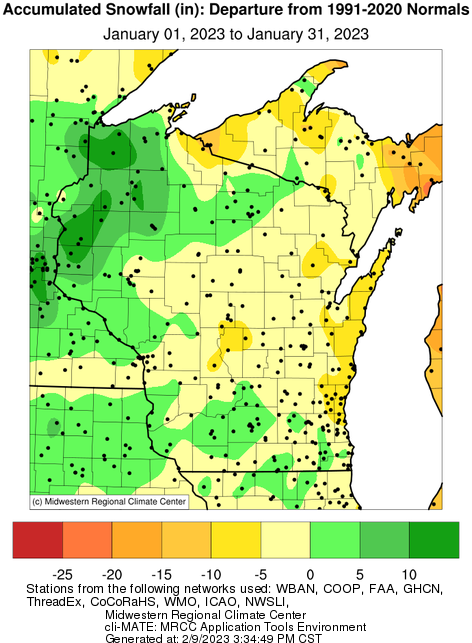
January 2023 Wisconsin Climate Summary
Maps of 2020 temperature and precipitation data along with their departures from normal are available below.
Weather computer models and the seasonal forecasts of the NOAA Climate Prediction Center are available.
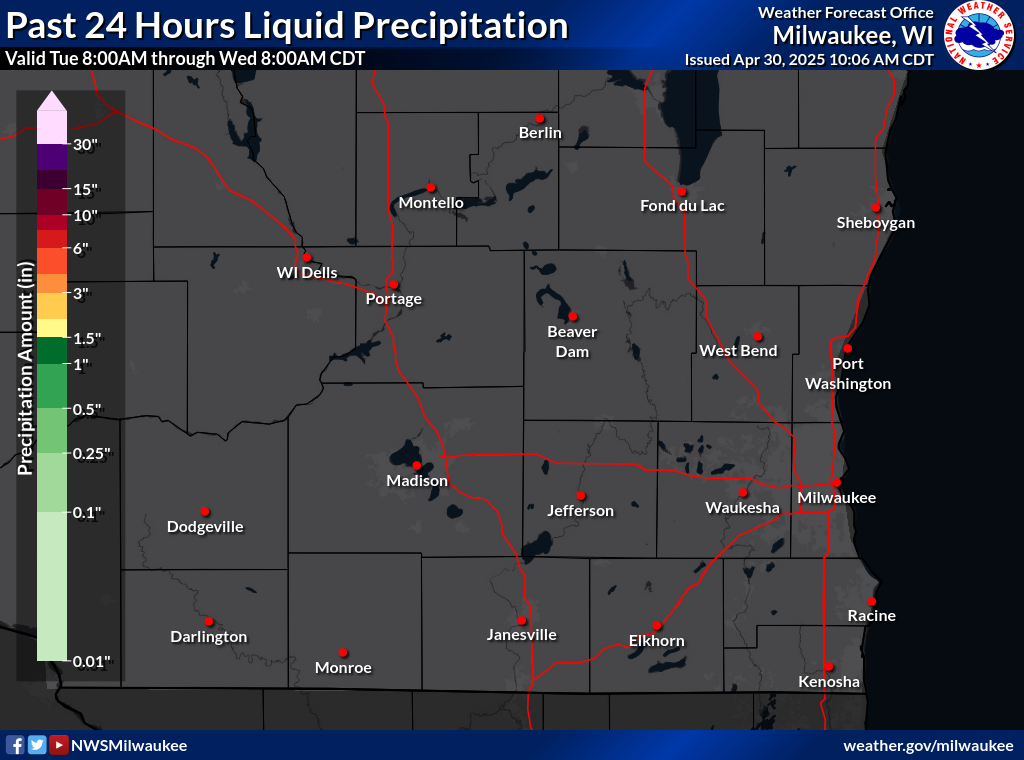
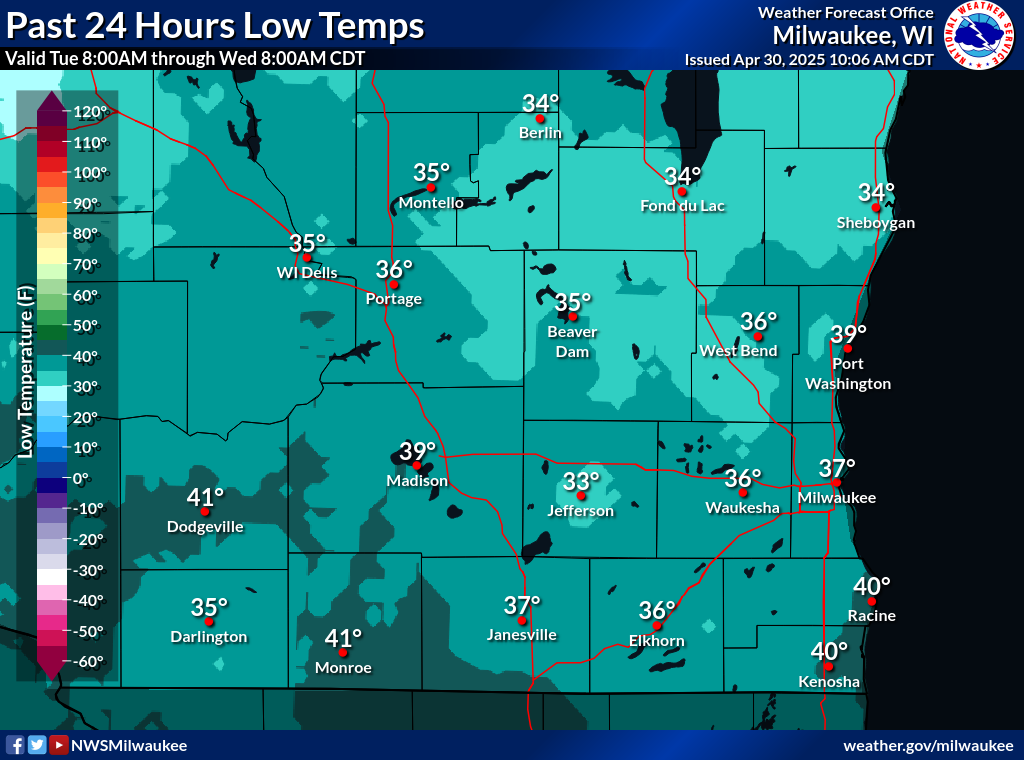
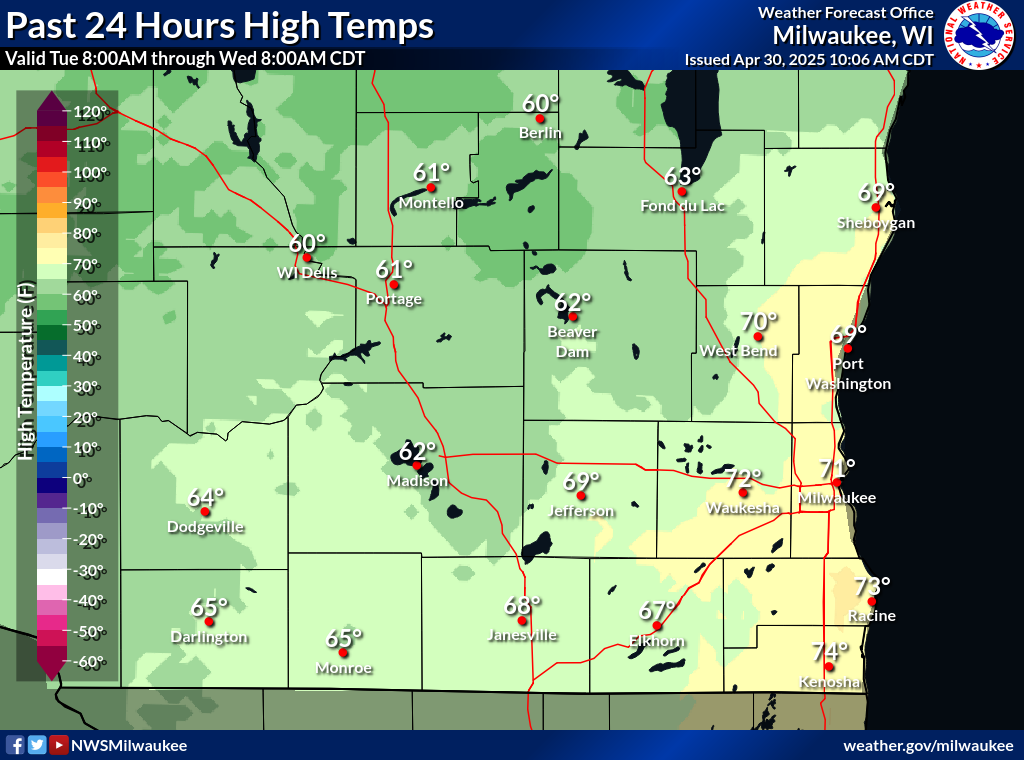
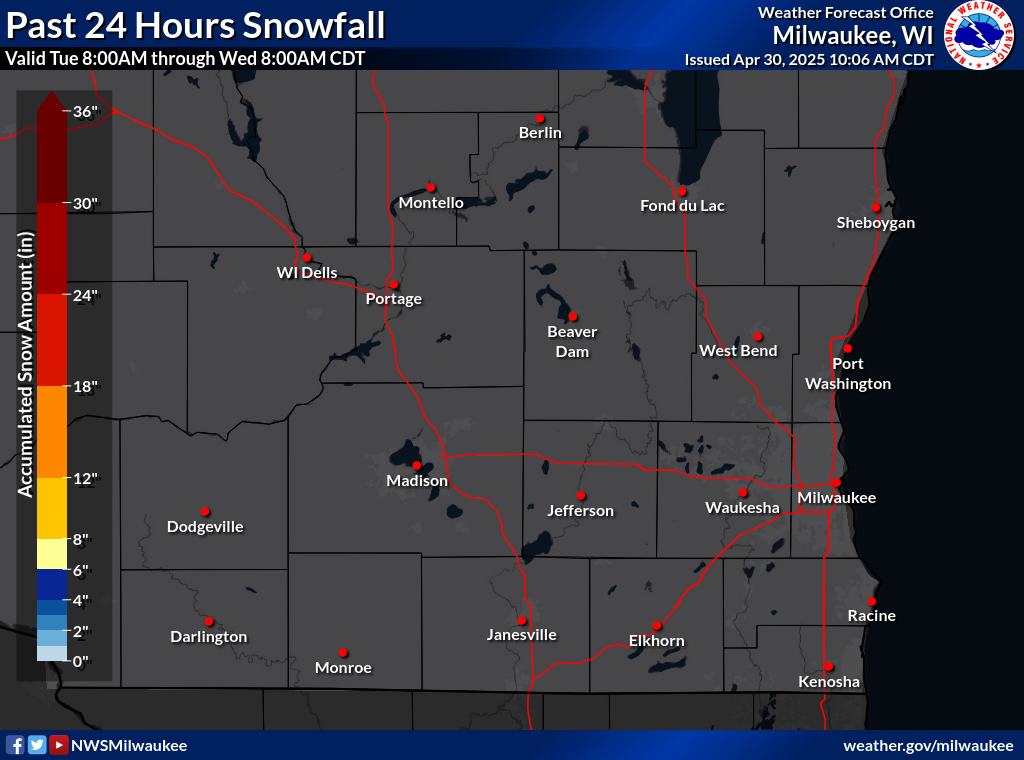
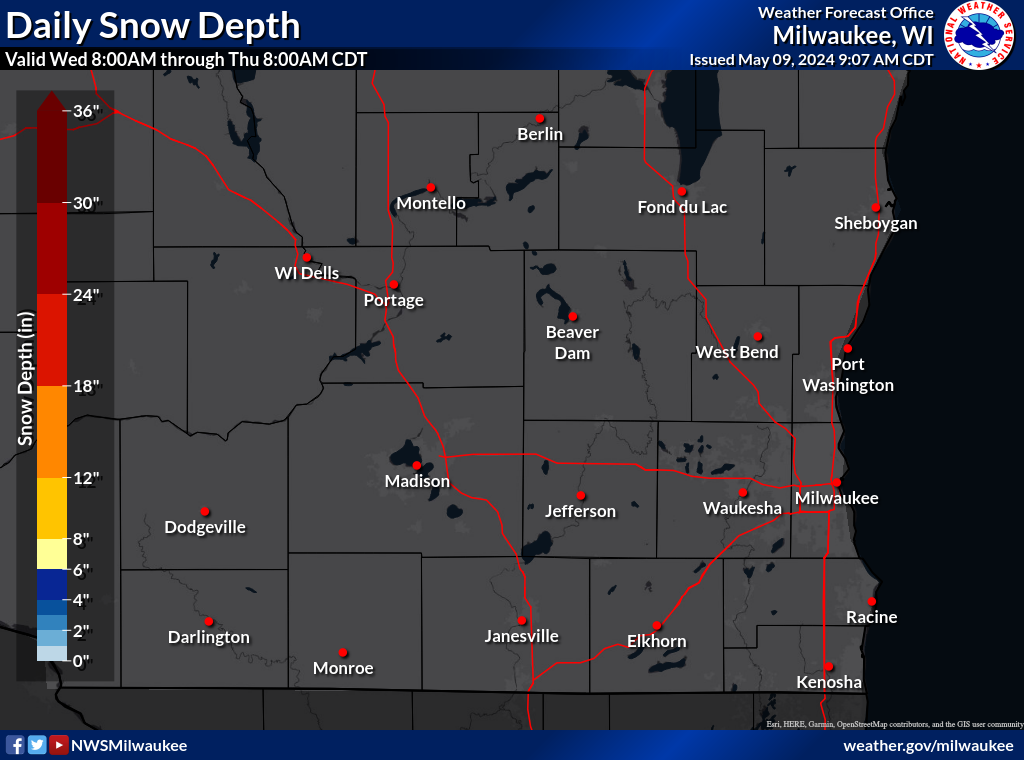
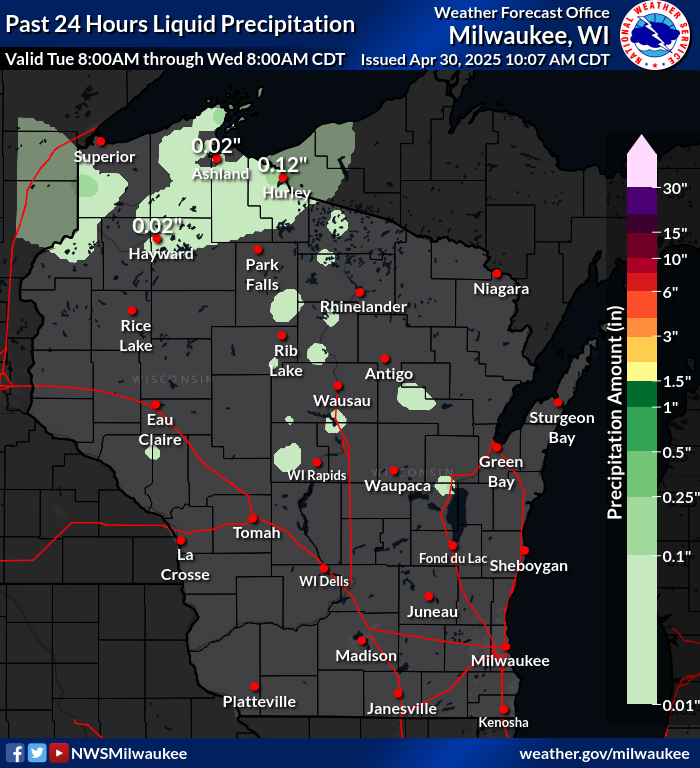
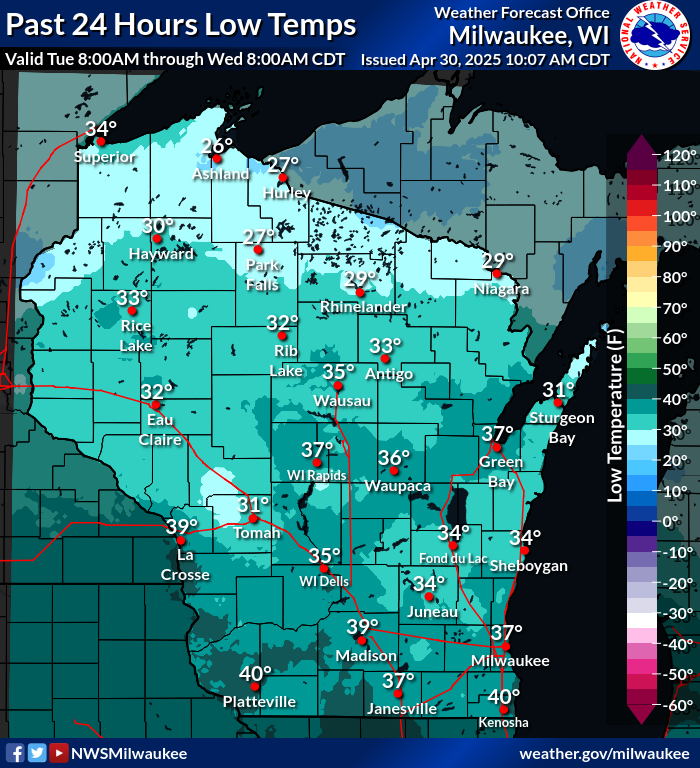
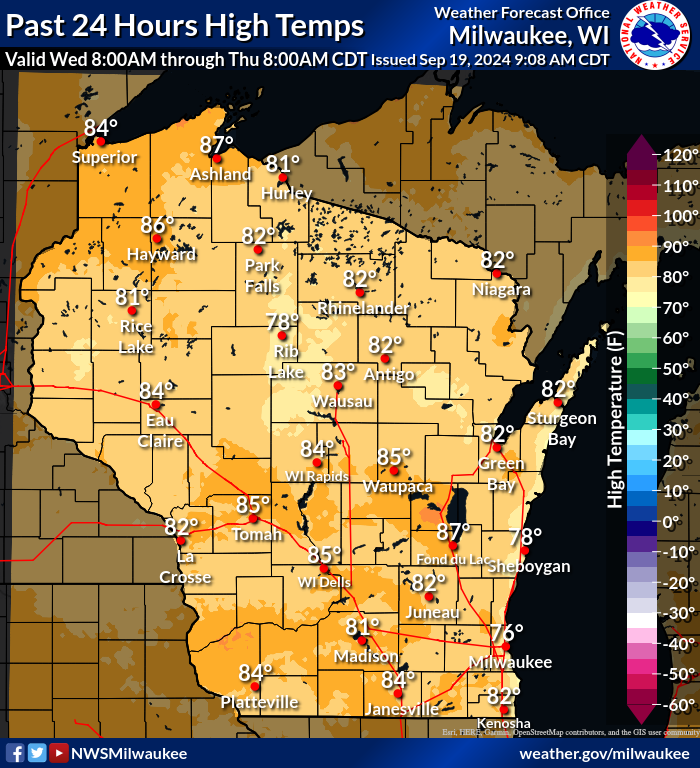
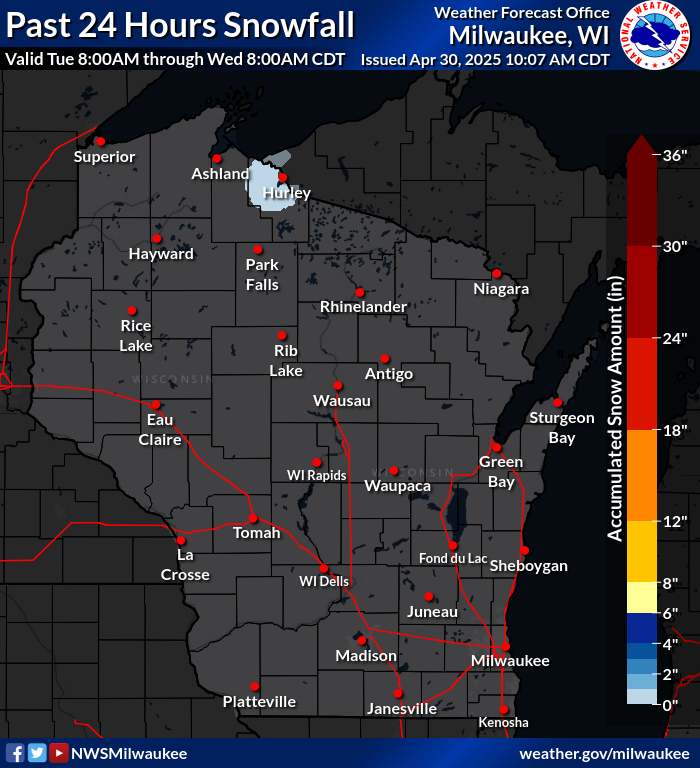
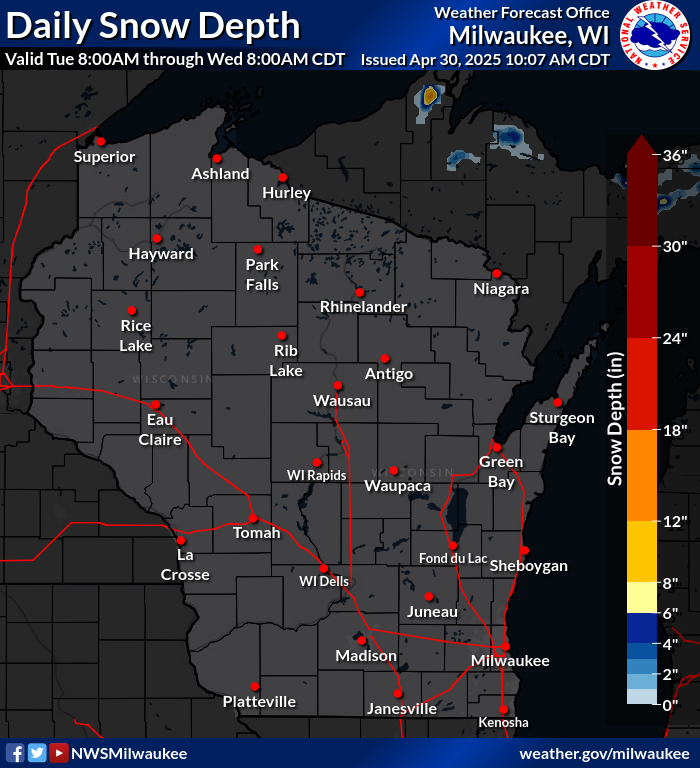
Last 24 Hours - Courtesy of NWS
Sullivan (updated by 8:00 am Central Time)
- Southern Wisconsin
- Statewide
Note: These maps contain contours and have a limited number of plotted data. For map with additional plotted data that does not have contours, consult NWSFO Milwaukee/Sullivan "Past Weather Graphs, Analysis and Data Plots" at https://www.weather.gov/mkx/climate_graphs-plots
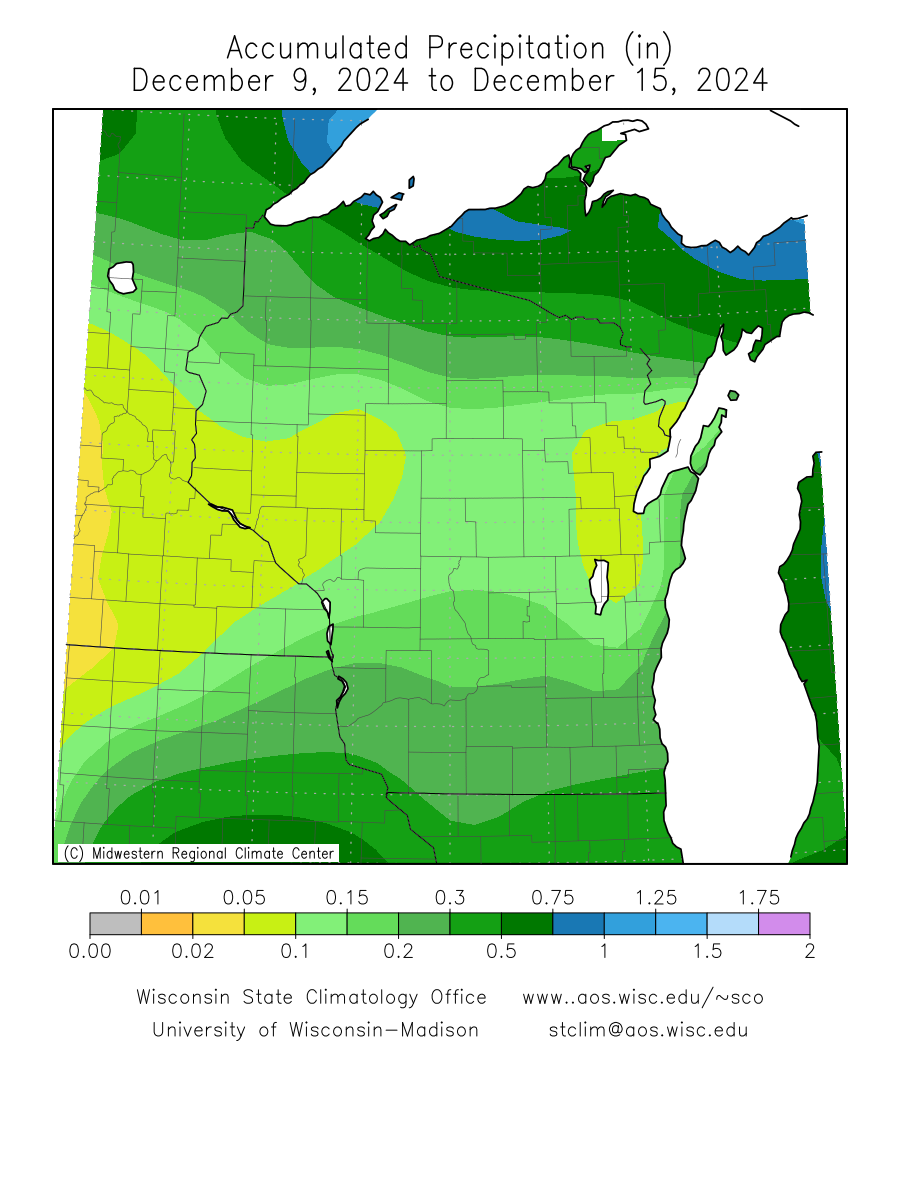
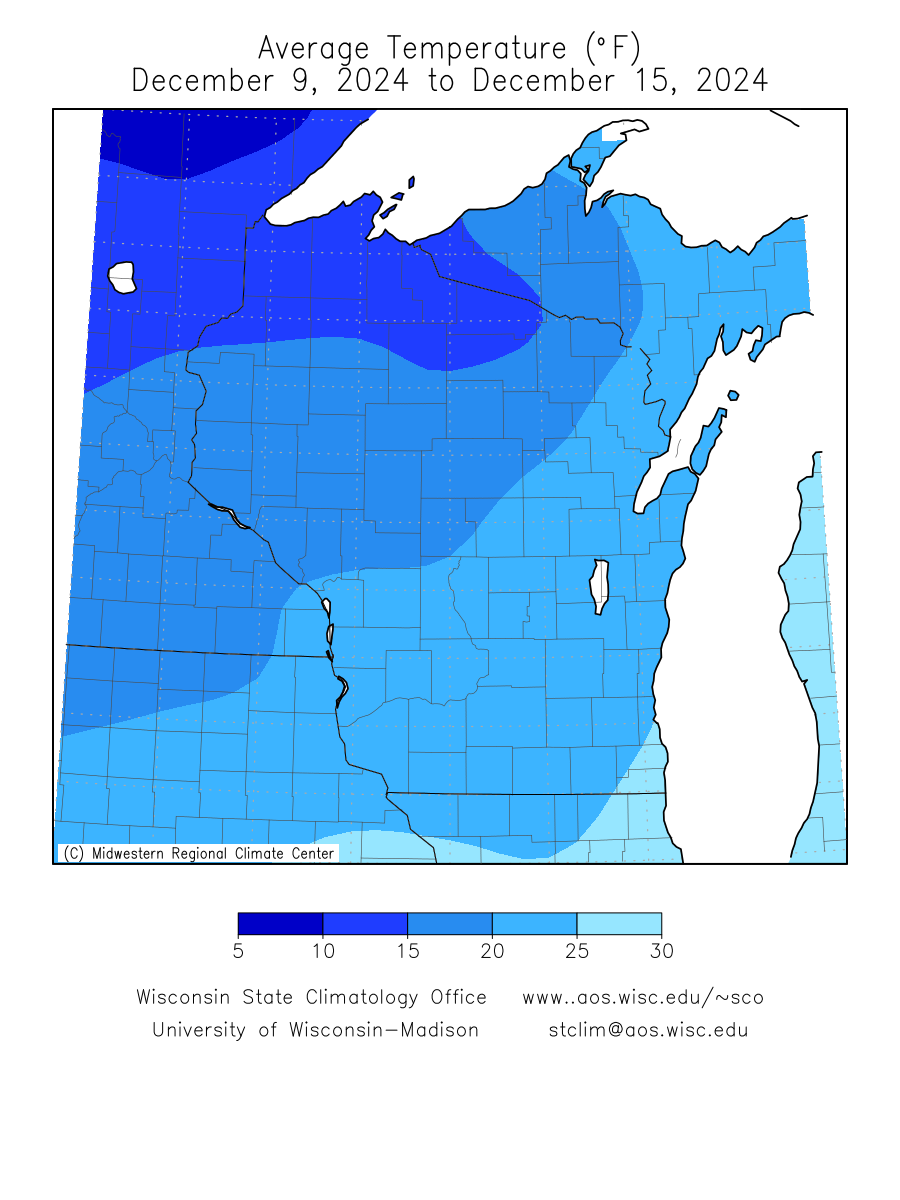
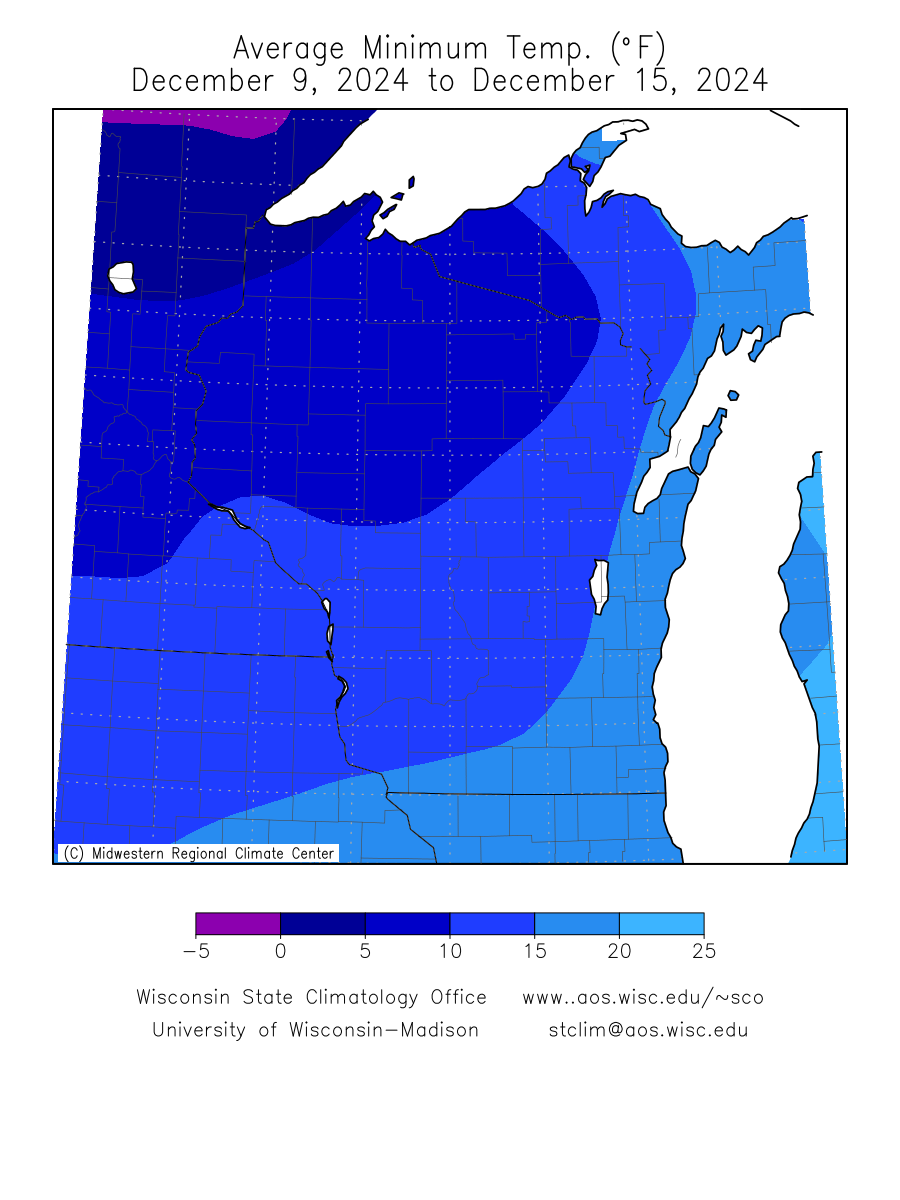
Last 7 Days (Statewide Maps) - updated by 10:30am Central Time
Last 30 Days (Statewide Maps) - updated by 10:30am Central Time
Last 90 Days (Statewide Maps) - updated by 10:30am Central Time
Recent precipitation data from NOAA NWS
- High-resolution Precipitation Maps from NOAA
Multi-sensor Precipitation Estimates (from NWS Radar Observations
and rain gauge data) for:
- 1-day to 1-year Precipitation Estimates for
National
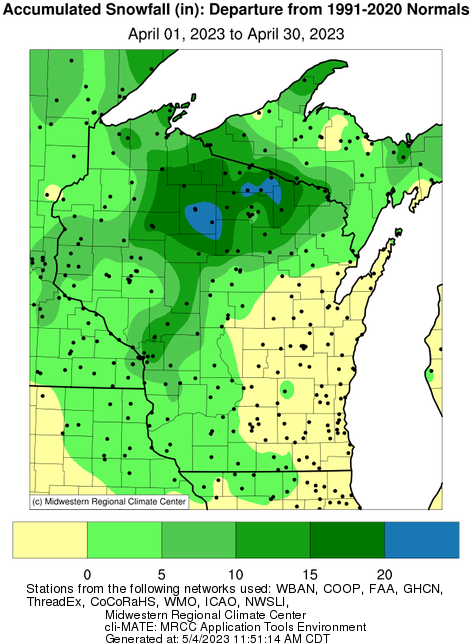
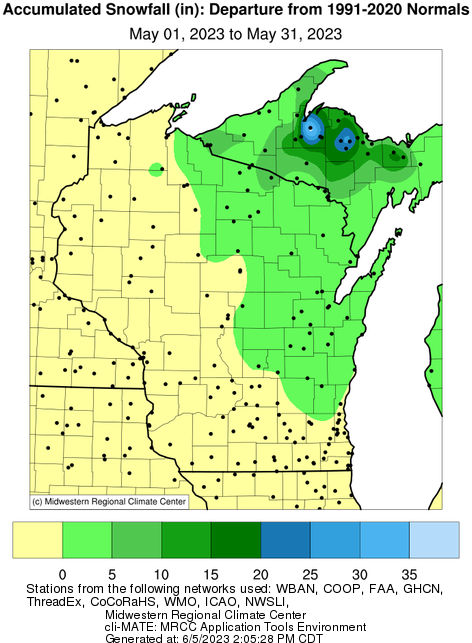
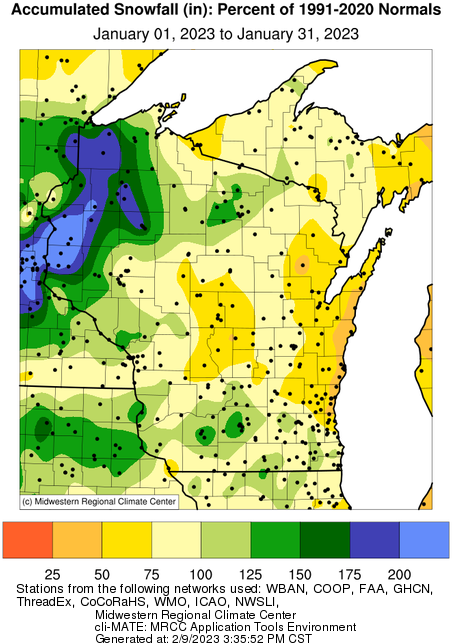
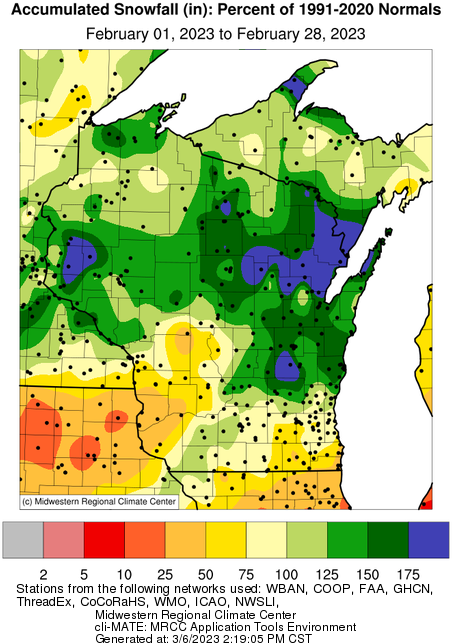
Monthly 2023 Statewide Maps -
Courtesy of Midwestern Regional Climate Center
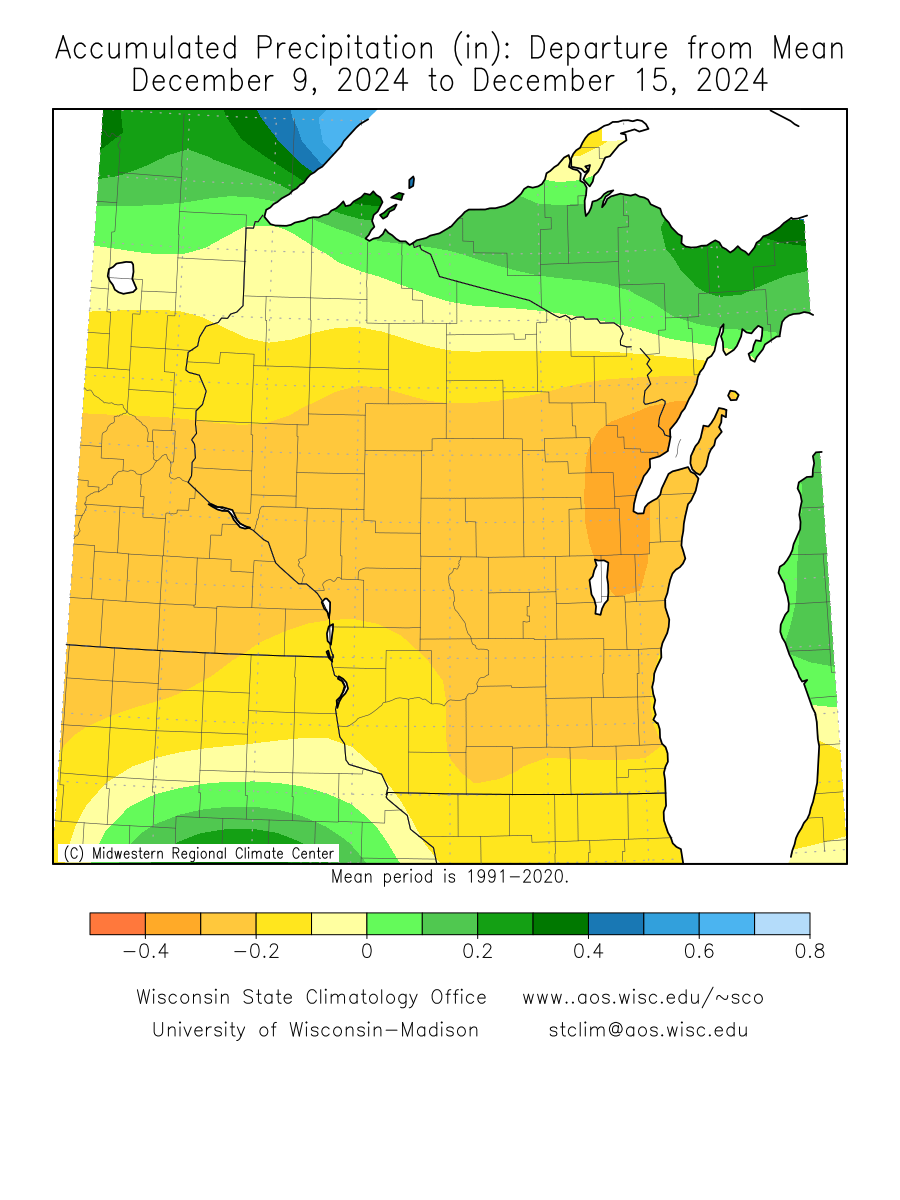
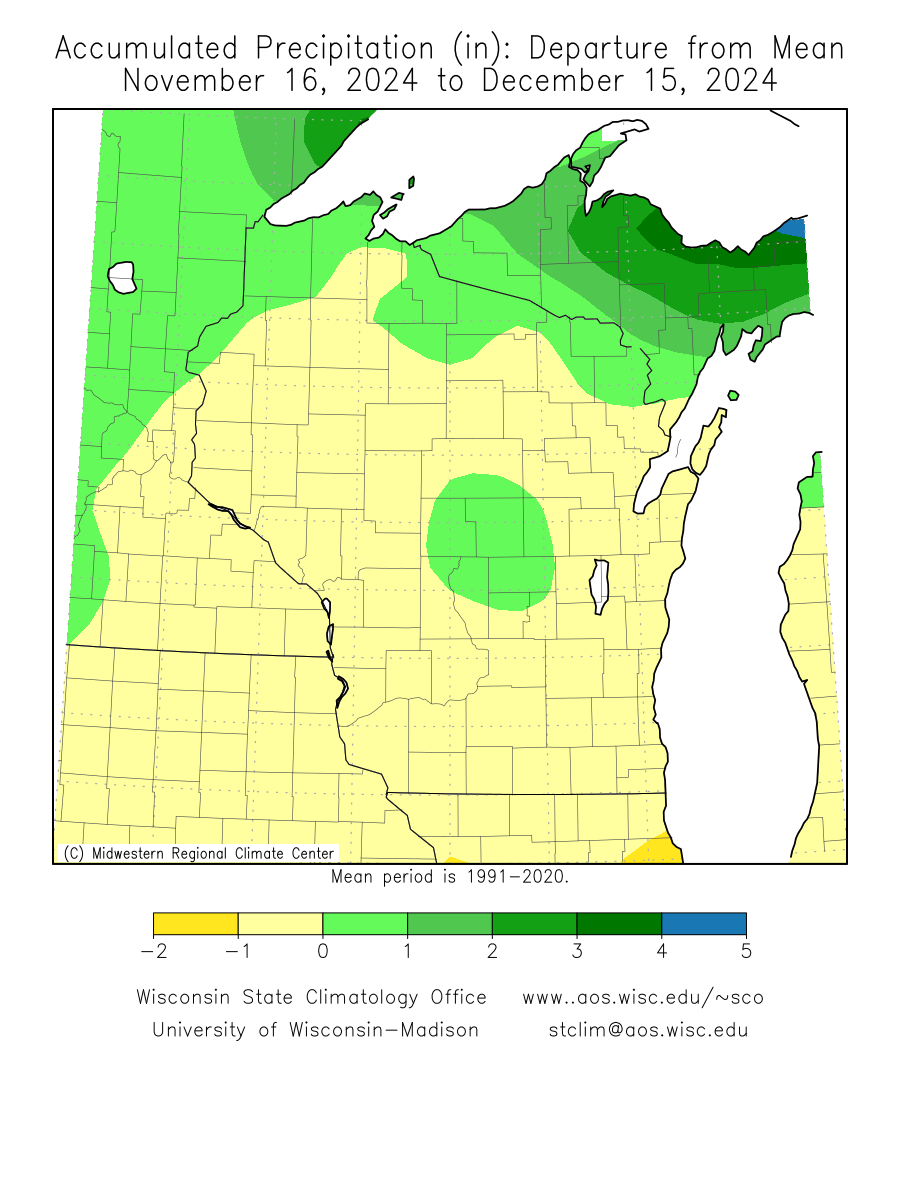
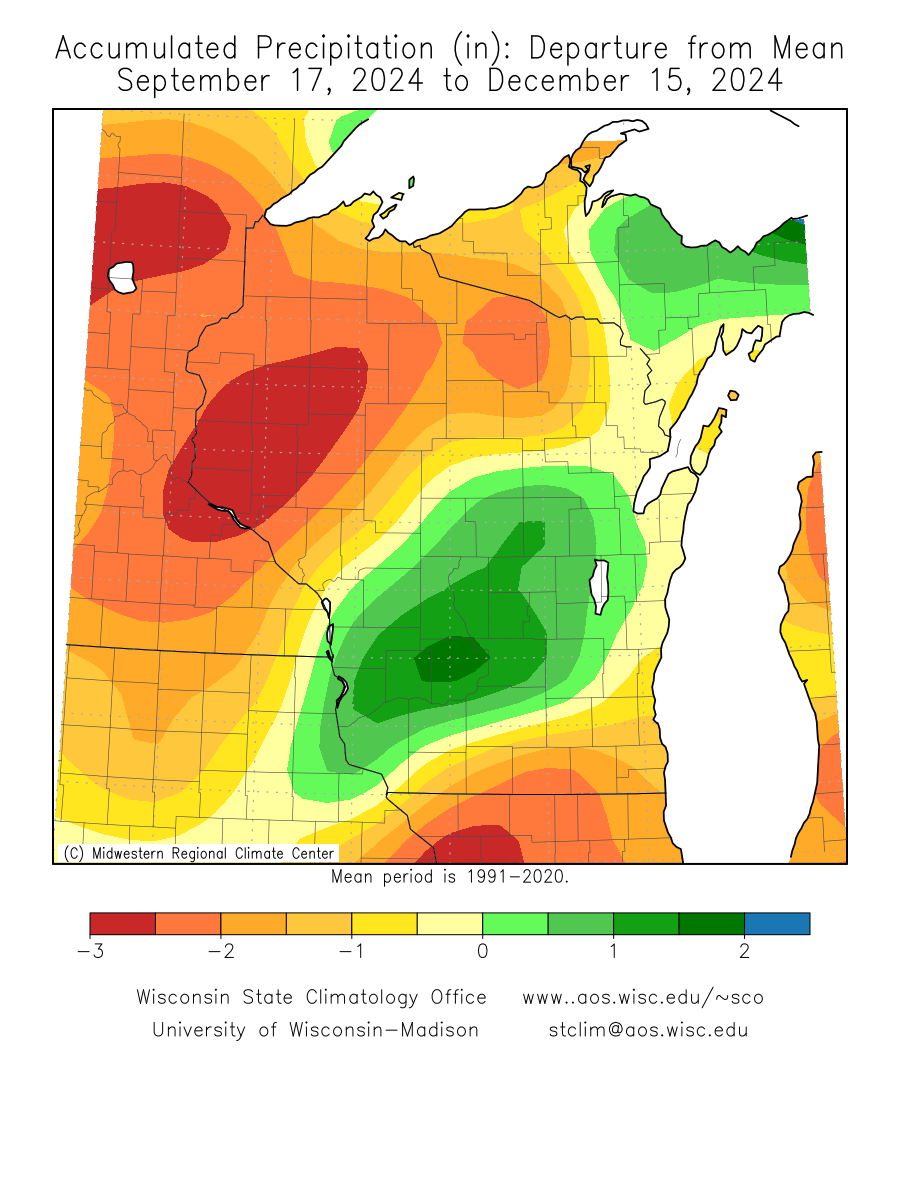
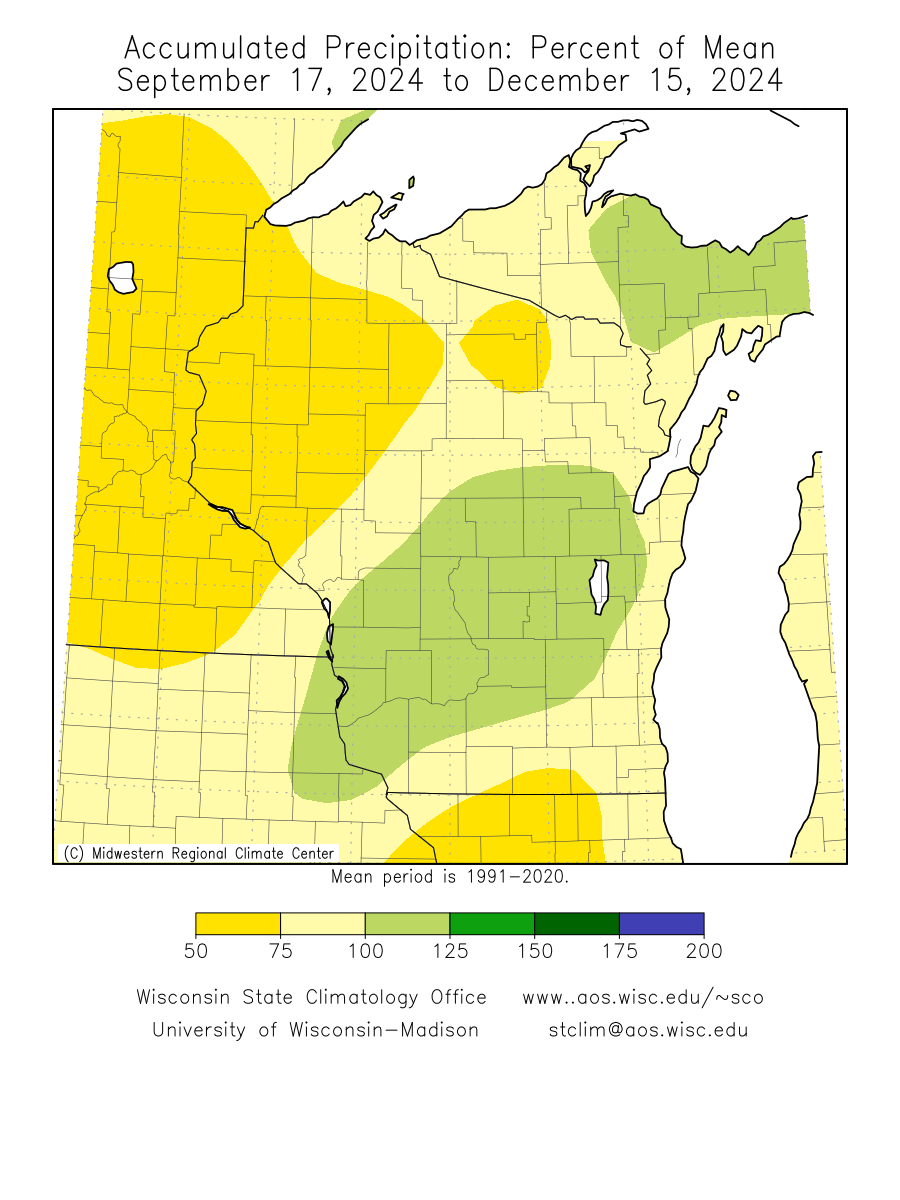
- Precipitation (inches) - and departures from 1991-2020 Normals
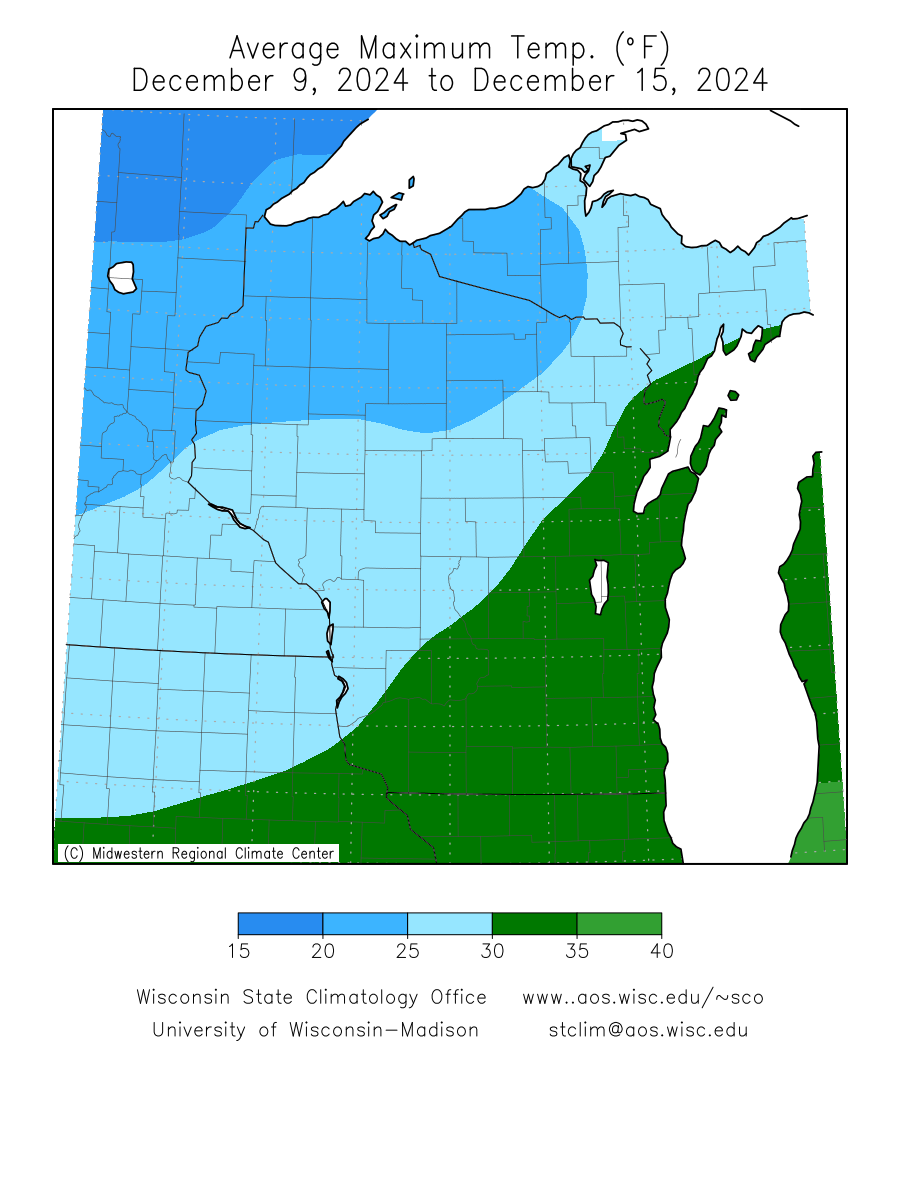
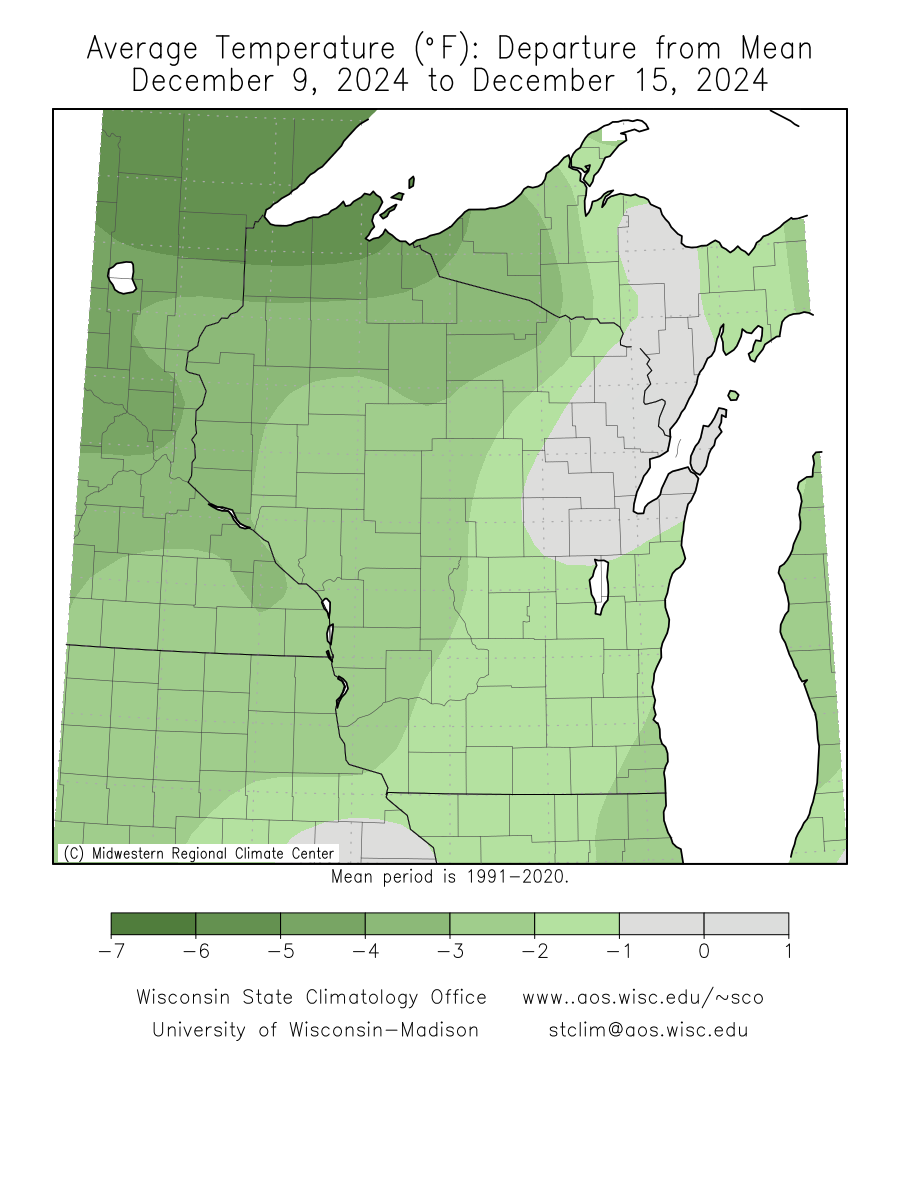
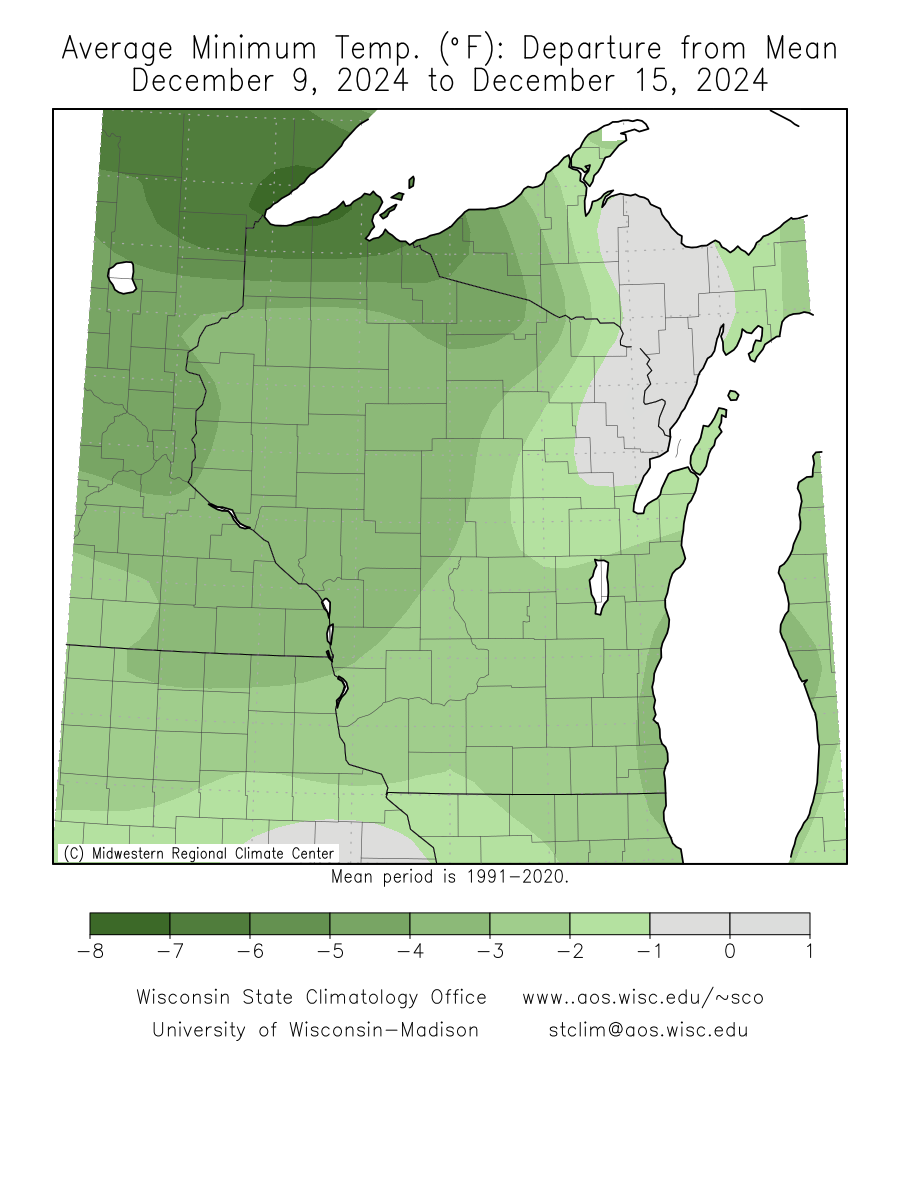
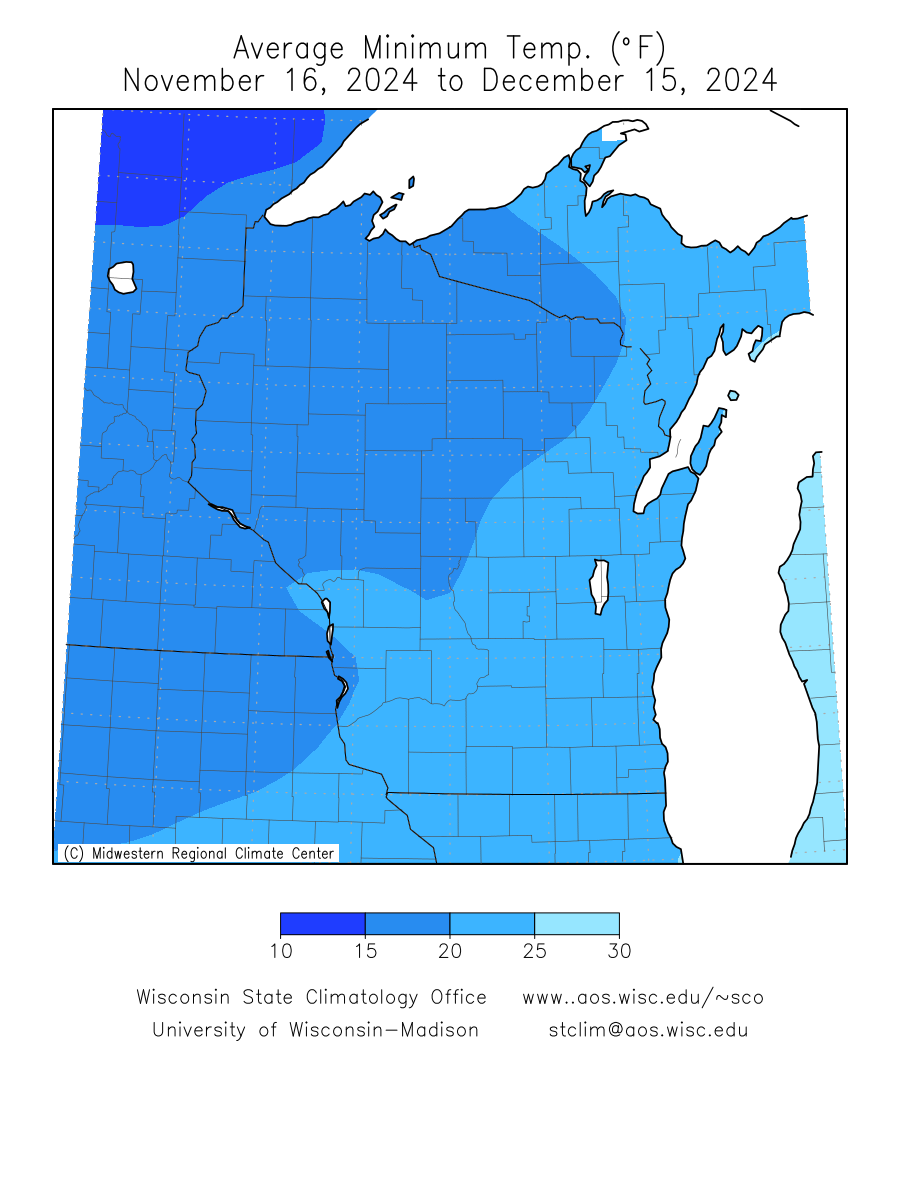
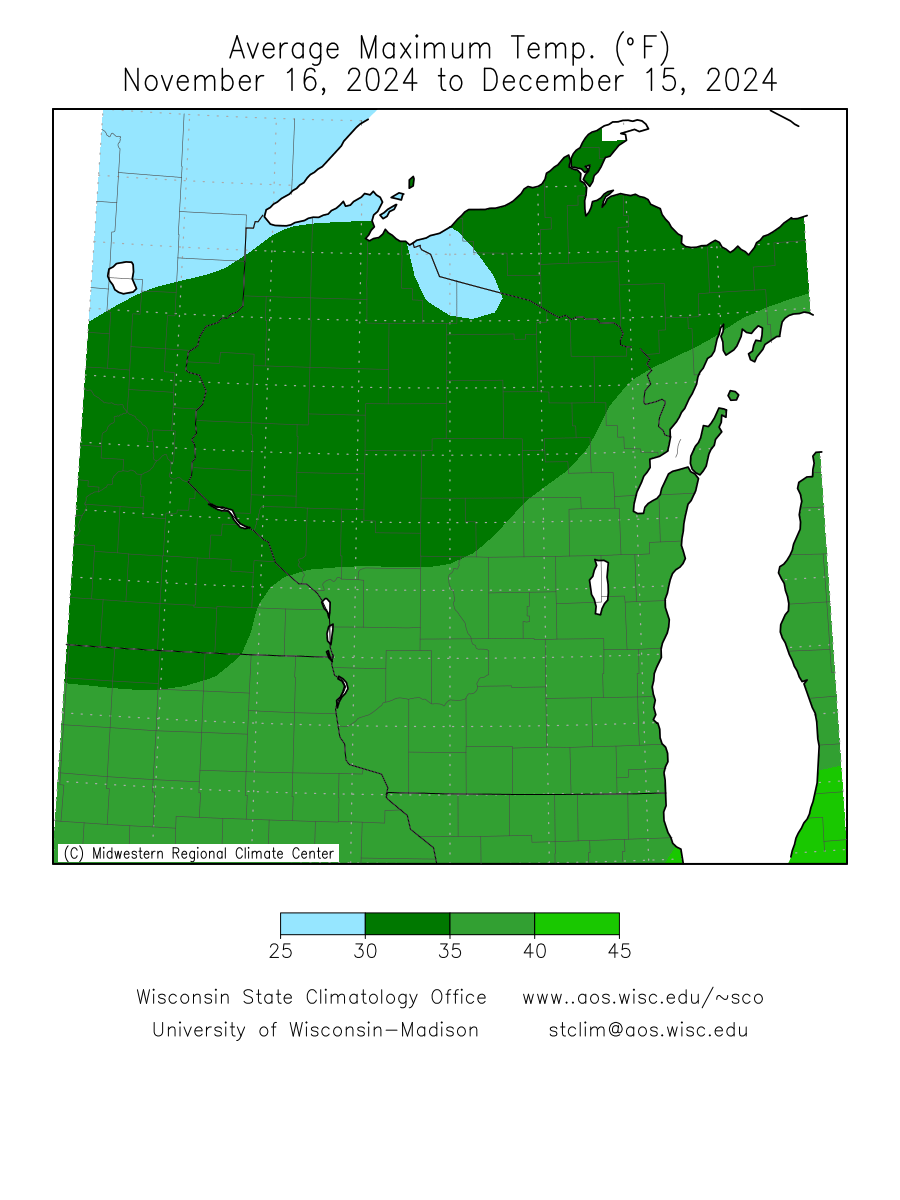
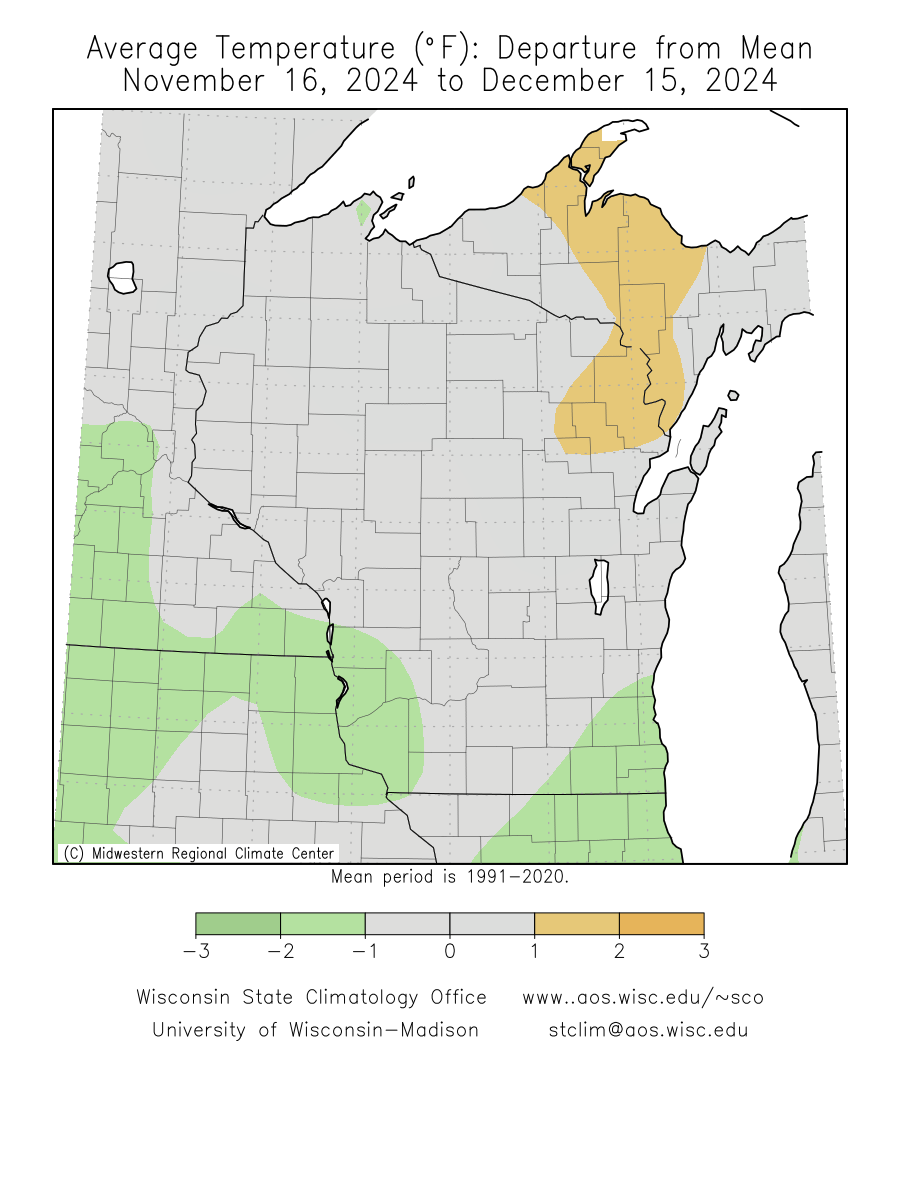
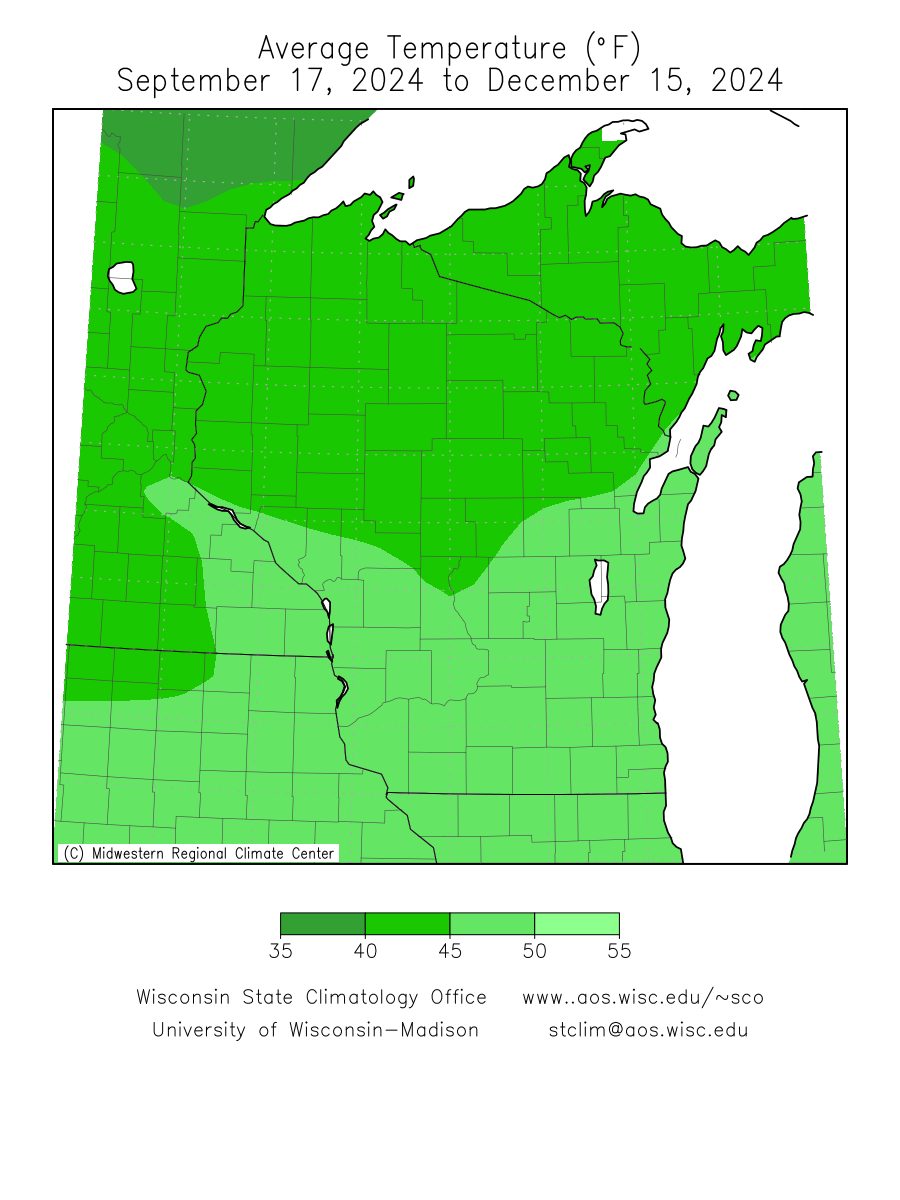
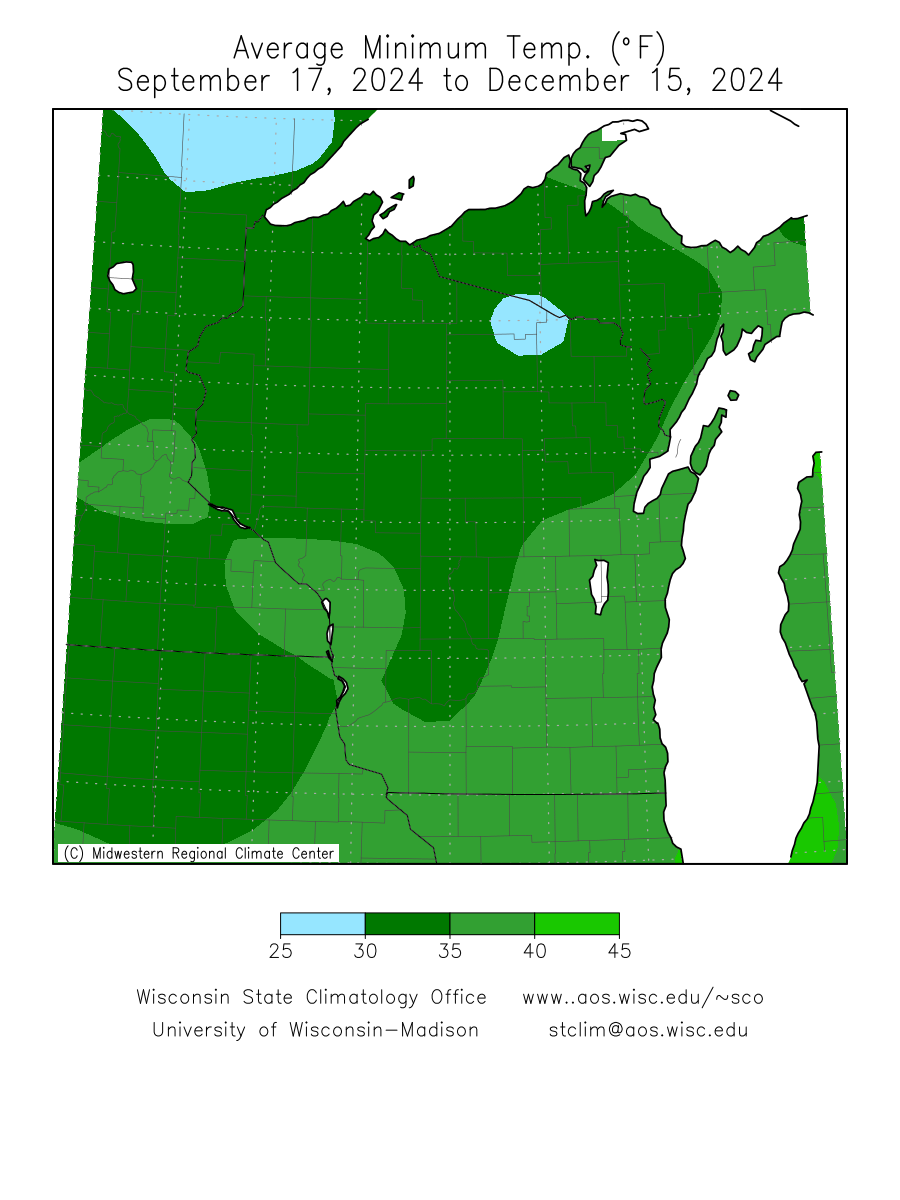
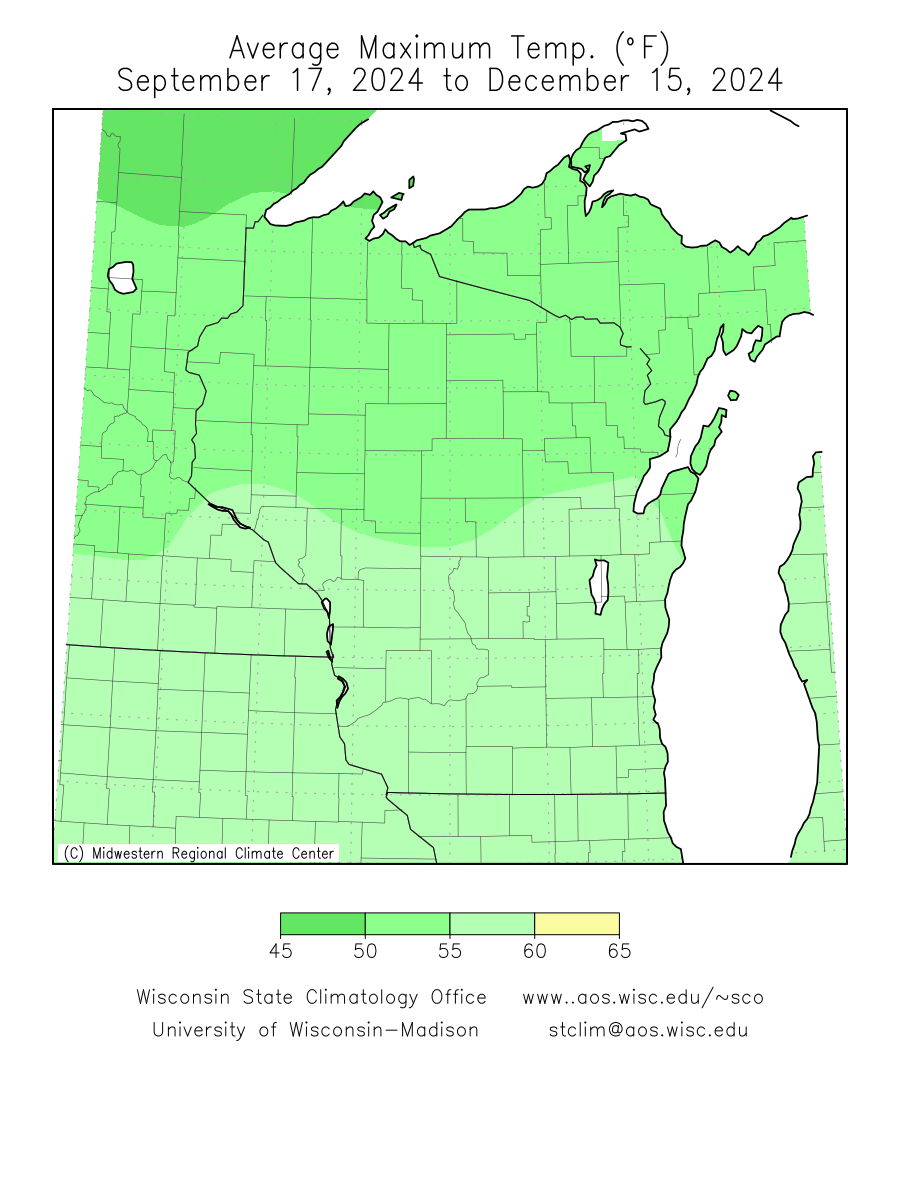
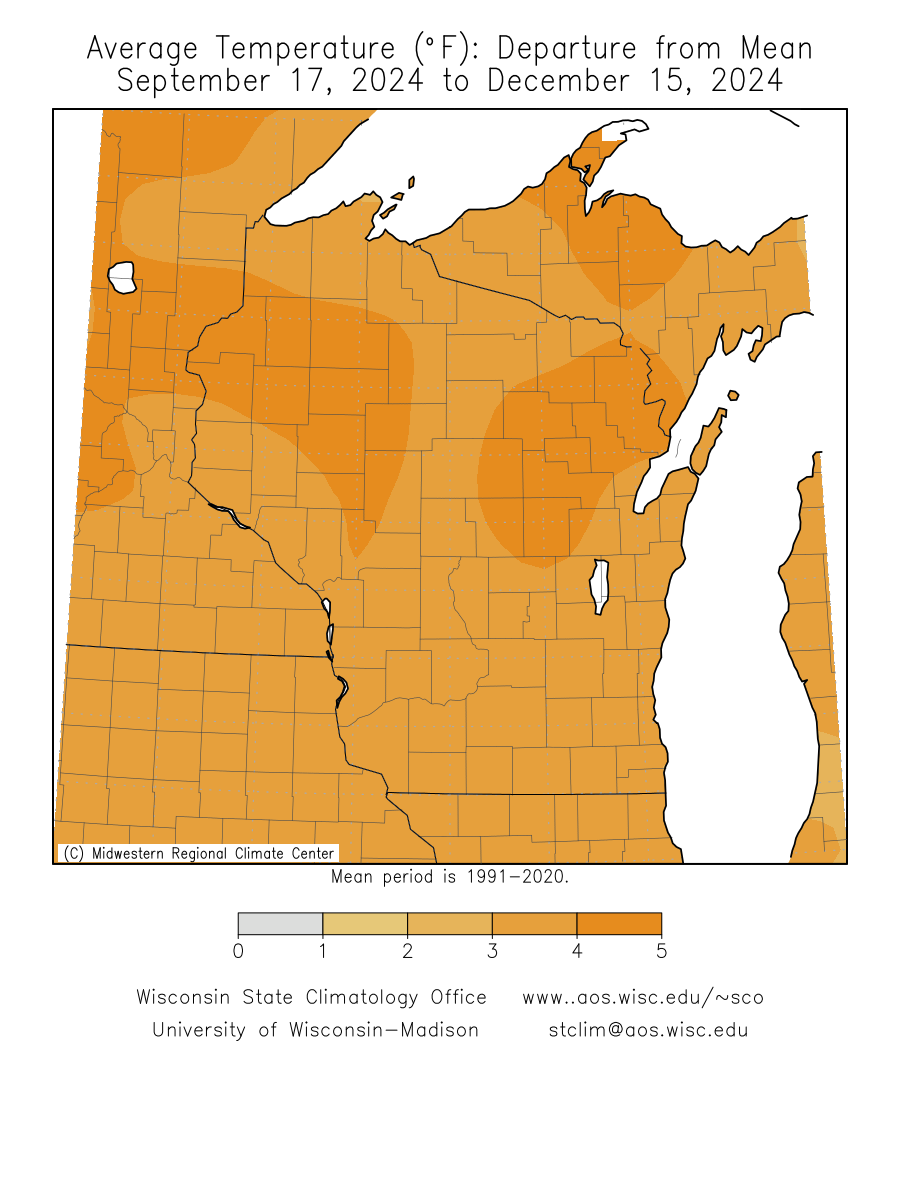
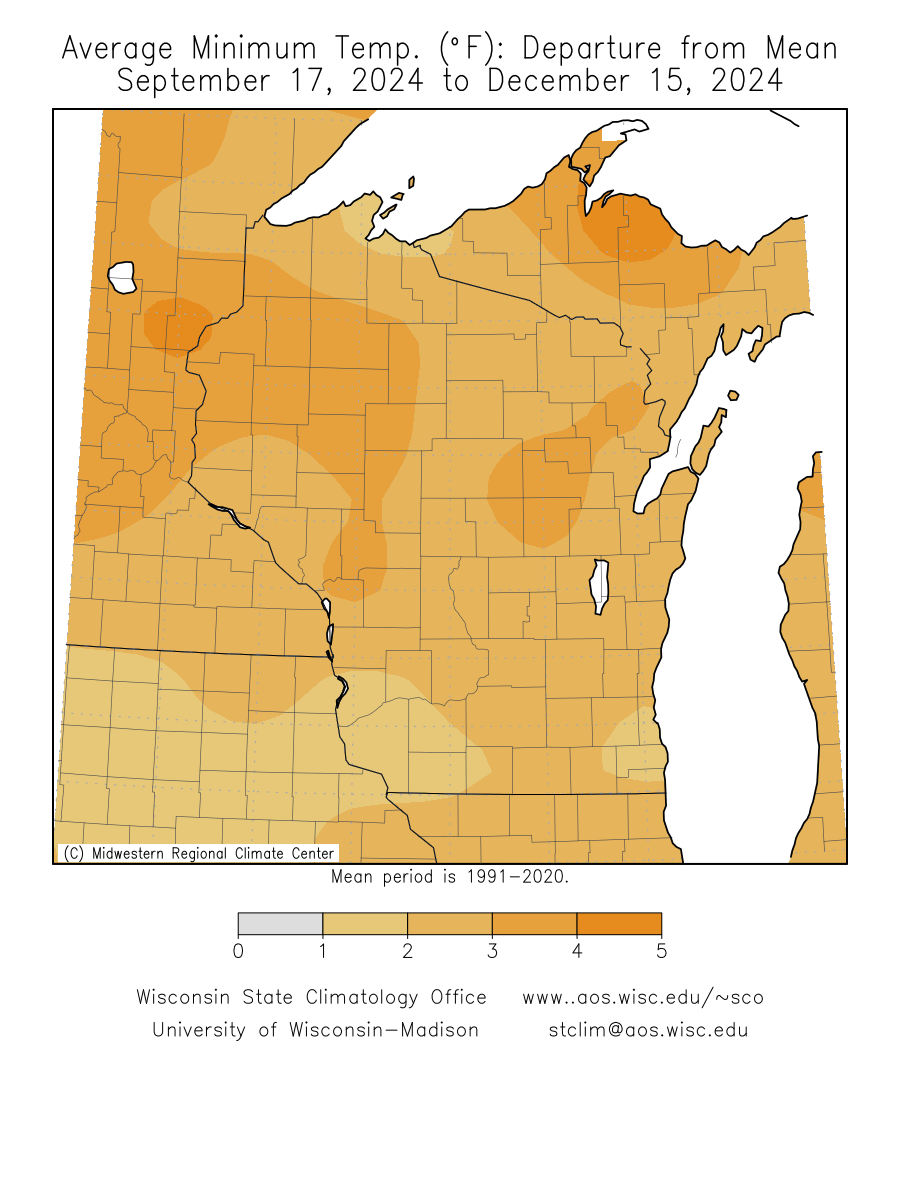
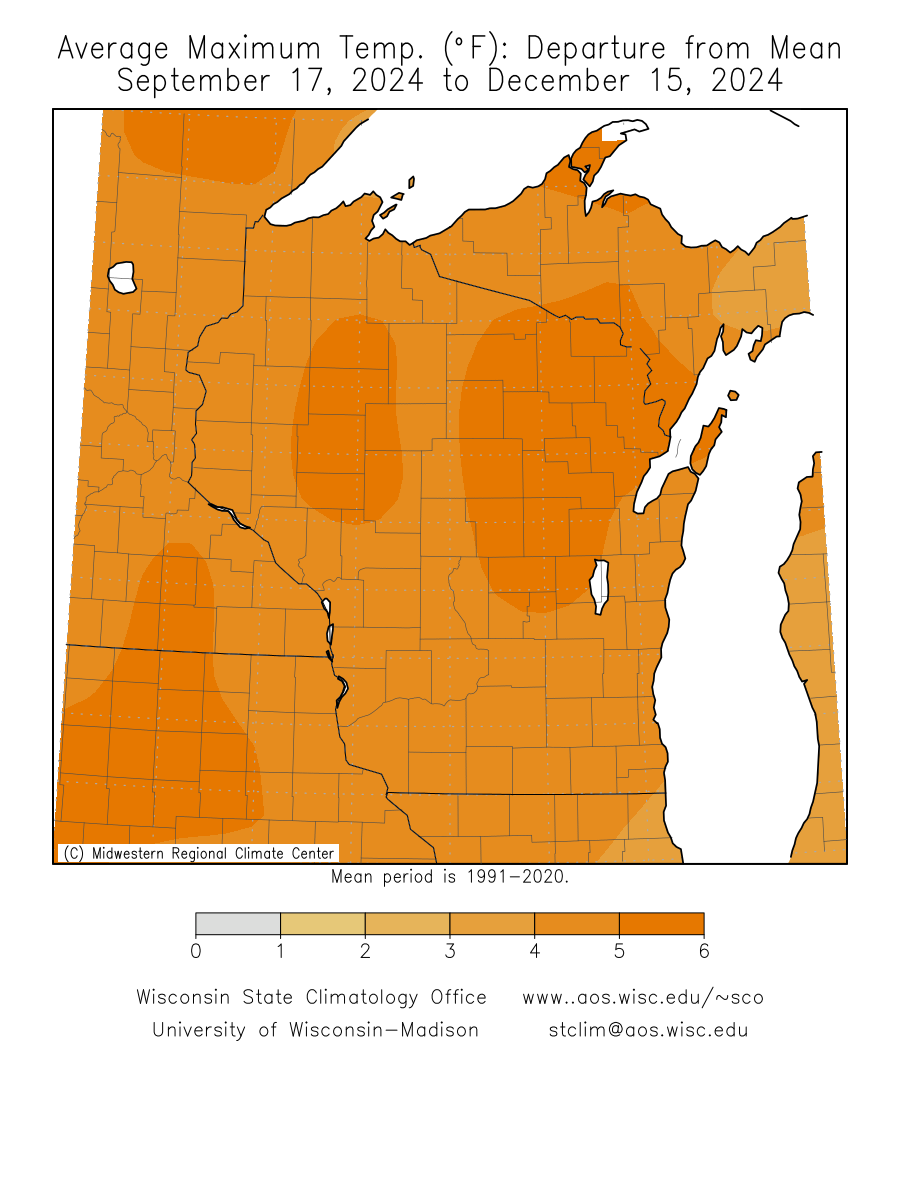
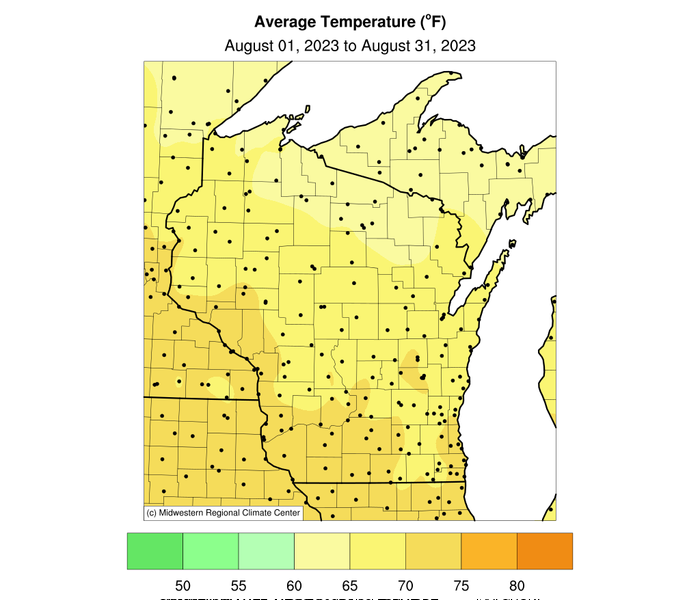
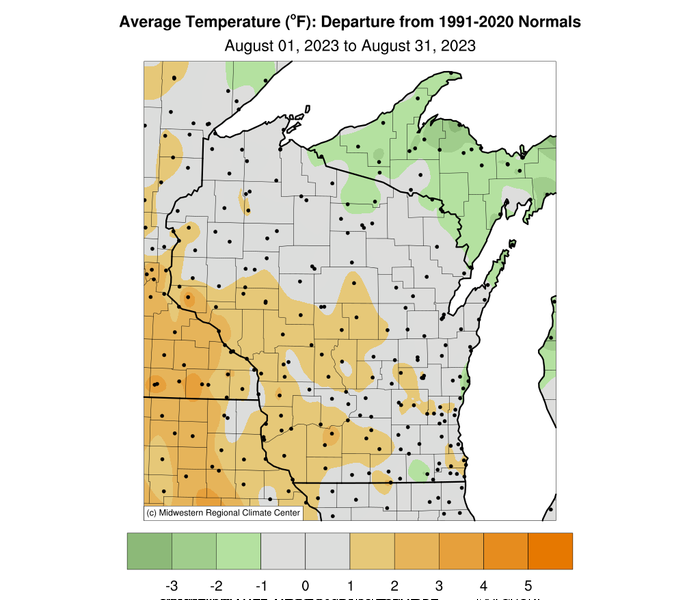
- Mean Temperature (F) - and departures from 1991-2020 Normals
- Snowfall (inches) - and departures from 1991-2020 Normals
| Month | Jan | Feb | Mar | Apr | May | Jun | Jul | Aug | Sep | Oct | Nov | Dec |
| Actual | A | A | A | A | A | A |
A | A | A | A |
A |
A |
| Departure | D | D | D | D | D | D |
D | D | D | D |
D |
D |
| % of normal |
P |
P | P | P | P |
P |
P |
P |
P |
P |
P |
P |
- See
archive of statewide monthly precipitation, temperature and
snowfall maps for previous years (2001-2021)
Last 12 Months Averages
The data for these products come from the U.S. Cooperative Network, augmented by observations from NWS and FAA sites. These cooperative sites are operated by volunteer observers using approved instruments and observing techniques. Their efforts that provide sufficient data to generate these products are greatly appreciated.
- Statewide Monthly Averages for Last 12 Months and
departures from 1991-2020 Normals
- Divisional Monthly Averages for Last 12 Months
- Temperature (and departure from 1991-2020 normals)
- Precipitation (and departure from 1991-2020 normals)
- See
archive of statewide-averaged data for previous years (2001-2020)
Wisconsin Drought Issues
Midwest to Global
Tables, maps,
other graphics and narratives describing the climate of the Midwest,
the United States and the globe over the last week to one year are
available.
Forecasts & Outlooks
- County-level agricultural forecasts are available for all Wisconsin Counties courtesy of the University of Kentucky
Agricultural Weather Center
- Local 3-month temperature outlook from National Weather
Service:
-
Southeastern and South central (Beloit, Dodgeville, Fond du Lac, Kenosha, Madison, Milwaukee, Montello, Oconomowoc, Port Washington, Wisconsin Dells
-
West central, Central, and Southwest Wisconsin (La Crosse, Lancaster 4WSW, Mather 3W, Medford, Viroqua 2S)
-
Northeast and East central Wisconsin (Appleton, Green Bay, Laona, Oshkosh, Rhinelander, Shawano, Sturgeon Bay, Two Rivers, Wausau, Wisconsin Rapids)
-
West central and Northwest Wisconsin (Eau Claire, Rice Lake)
-
Northwest and North central Wisconsin (Danbury, Duluth/Superior, Gurney, Park Falls)
-
Upper Peninsula of Michigan
(Ironwood, Iron Mountain, Stephenson, Stambaugh)
-
Northern Illinois (Rockford, Marengo)
-
Northeast Iowa and Northwest Illinois
(Dubuque, Freeport)
-
US Hazards Assessment (forecast) from Climate Prediction
Center:
|